.png)
The July 2026 release brings AI Assist cost data into core cost management workflows, expands Mavvrik MCP Server coverage across more of the platform, adds LiteLLM integration, and introduces a dedicated K8s Efficiency Dashboard. This release also includes Savings dashboard enhancements, Cost Allocation enhancements for shared cost splitting and segment trend visibility, and platform improvements across dashboards and the SaaS CSV Connector.
For more details, please reach out to your Mavvrik representative or check our updated documentation Help Center
|
Release Version |
Features |
|---|---|
|
Release-2026.07.15 |
|
AI Assist Cost Management Support
Use AI Assist cost data across budgets, alerts, allocations, reporting, and dashboards.
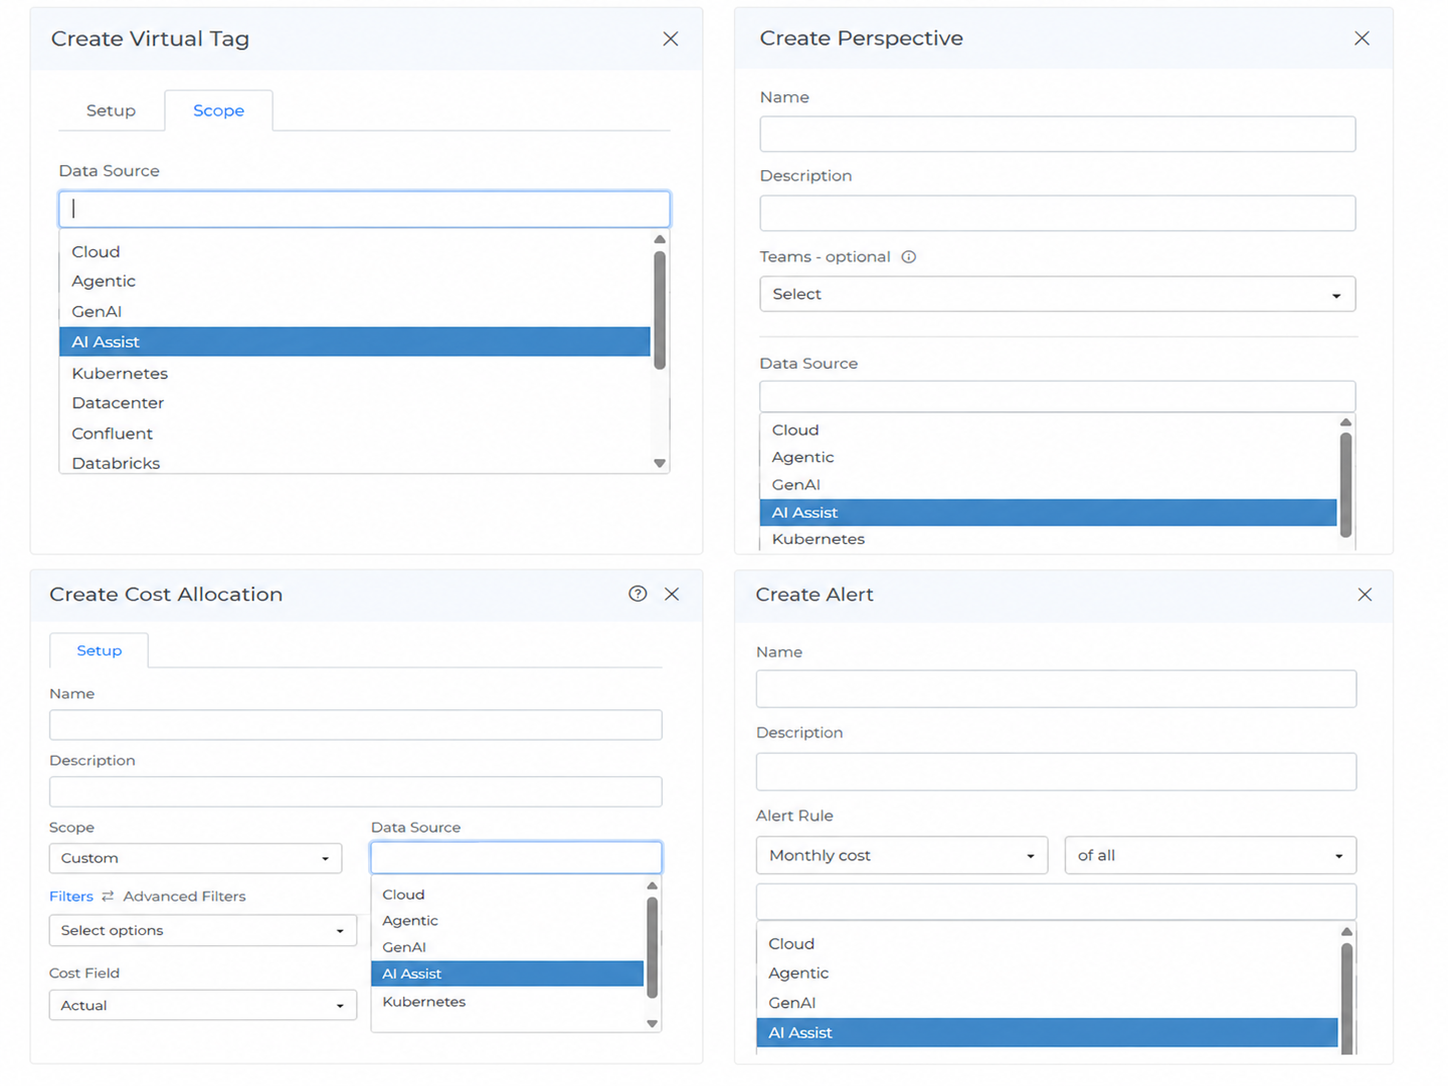
The last release introduced dedicated AI Assist cost visibility for tools like GitHub Copilot and Claude Enterprise. With this release, AI Assist cost data can now be used as a source across your core cost management workflows.
Create budgets, alerts, cost allocations, perspectives, virtual tags, custom dashboard widgets, and reports using AI Assist as a source, and manage AI assistant spend with the same controls and governance you already use for cloud and other cost areas.
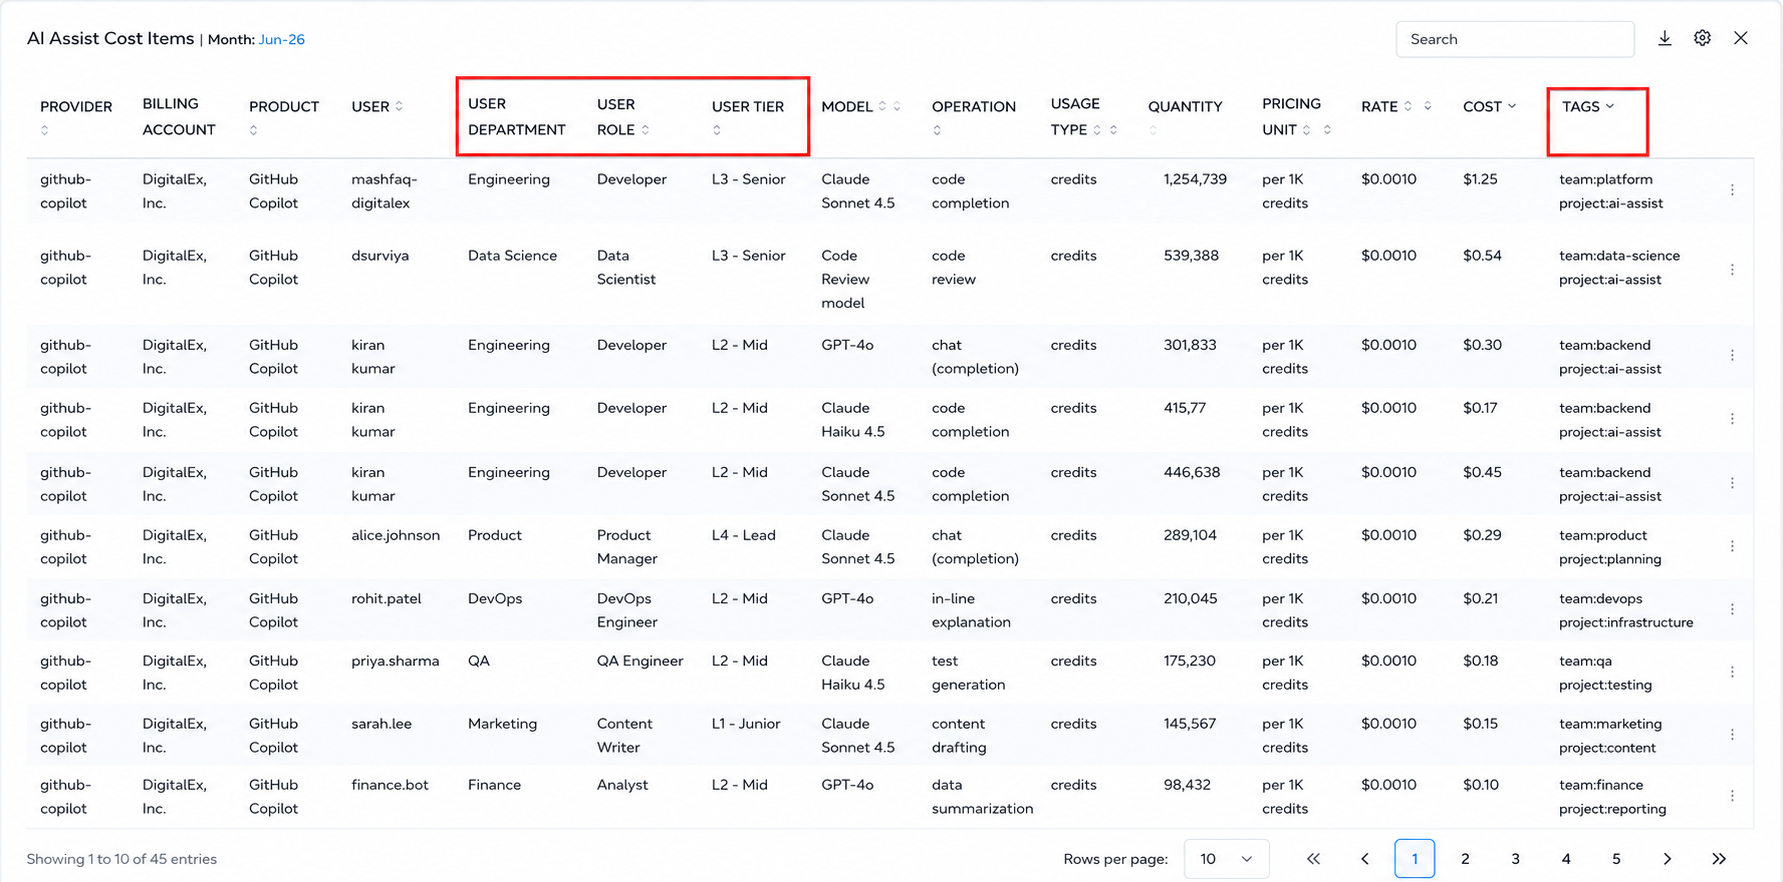
You can also now analyze AI assistant spend by Department, User Tier, User Role, and Tags, giving teams more user and organizational context when reviewing usage, adoption, and cost ownership.
Mavvrik MCP Server: Expanded Tool Coverage
Query more Mavvrik domains directly through MCP.
Mavvrik MCP Server already supports core cost intelligence areas such as Cloud Cost, Cost Variances, Recommendations, and Anomalies. This release expands coverage to more of the platform: Cloud Resources, GenAI (Platform Cost and Assist Cost), Commitments (RI, SP, and Coverage), Kubernetes (Cost, Cloud Cost, Efficiency, and Utilization), Tag Explorer, Cost allocation and SaaS Cost.
You can now ask questions across more of the platform in natural language and get answers from your connected Mavvrik data, without navigating multiple dashboards first.
To Connect Mavvrik MCP with Cursor refer Cursor
To Connect Mavvrik MCP with ChatGPT refer ChatGPT
To Connect Mavvrik MCP with Copilot 365 refer Copilot 365
To Connect Mavvrik MCP with Claude refer Claude
LiteLLM Integration
Track LiteLLM usage and cost directly in Mavvrik.
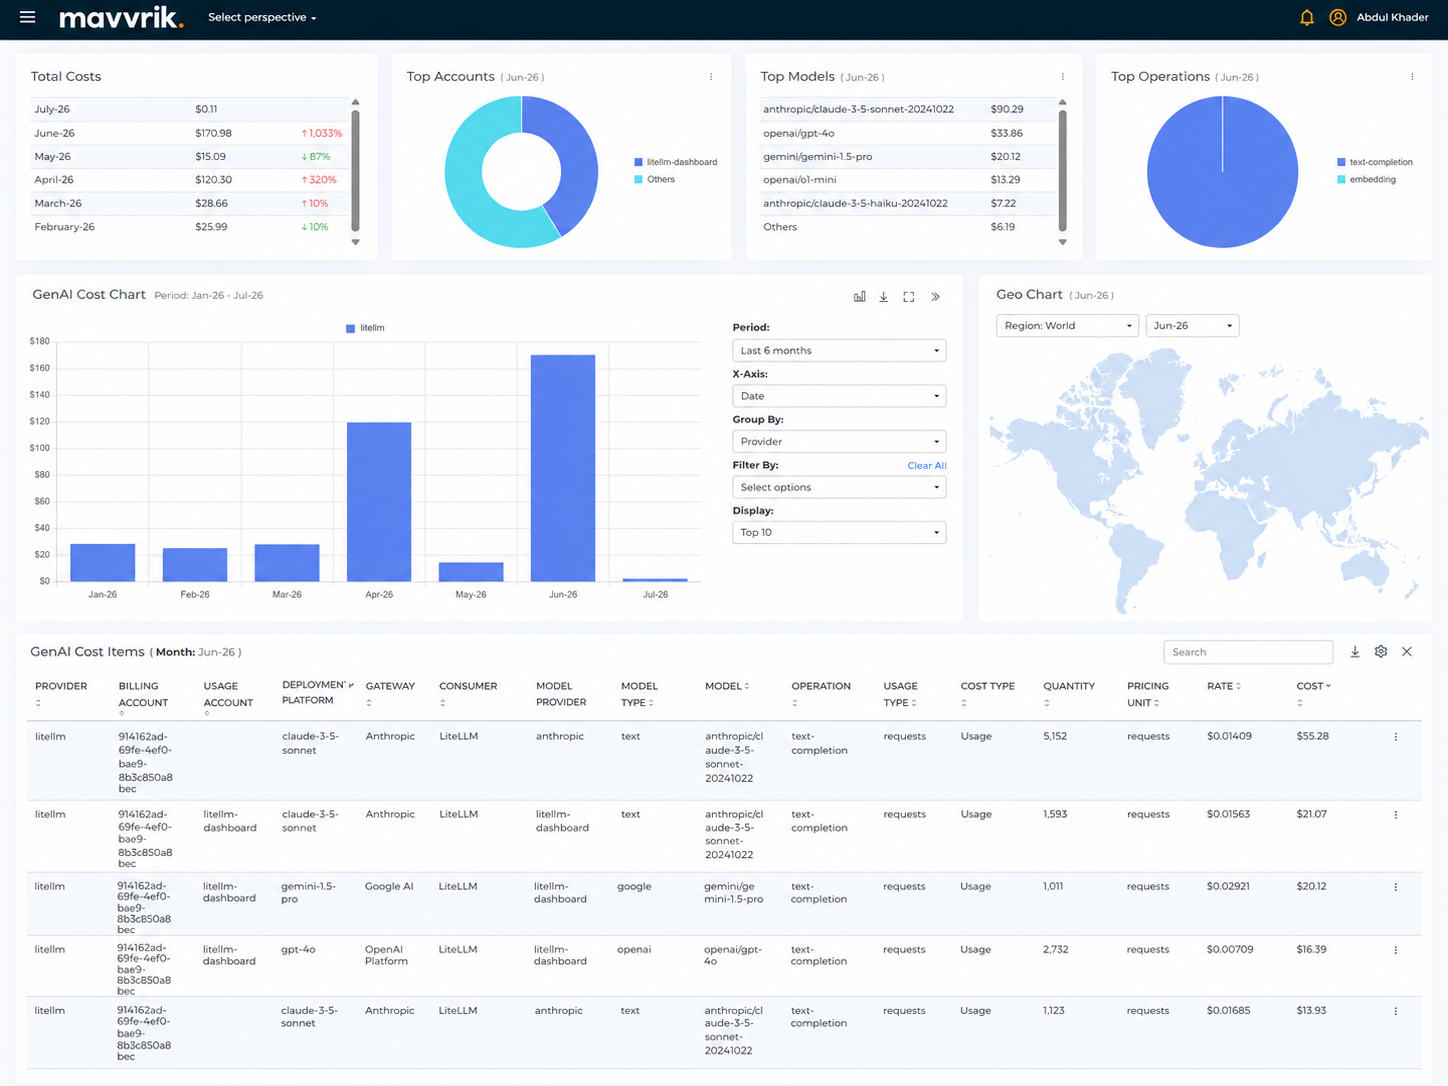
The LiteLLM integration brings visibility into LLM usage and cost routed through your LiteLLM gateway, so you can see how model usage across providers contributes to overall AI spend. Review usage patterns, model-level activity, and cost in one place, and pinpoint which models, providers, teams, or applications are driving spend over time.
This gives FinOps, engineering, and platform teams a clearer way to monitor LiteLLM-driven spend and bring AI usage into their broader cost management workflows.
To Onboard LiteLLM Refer LiteLLM
K8s Efficiency Dashboard
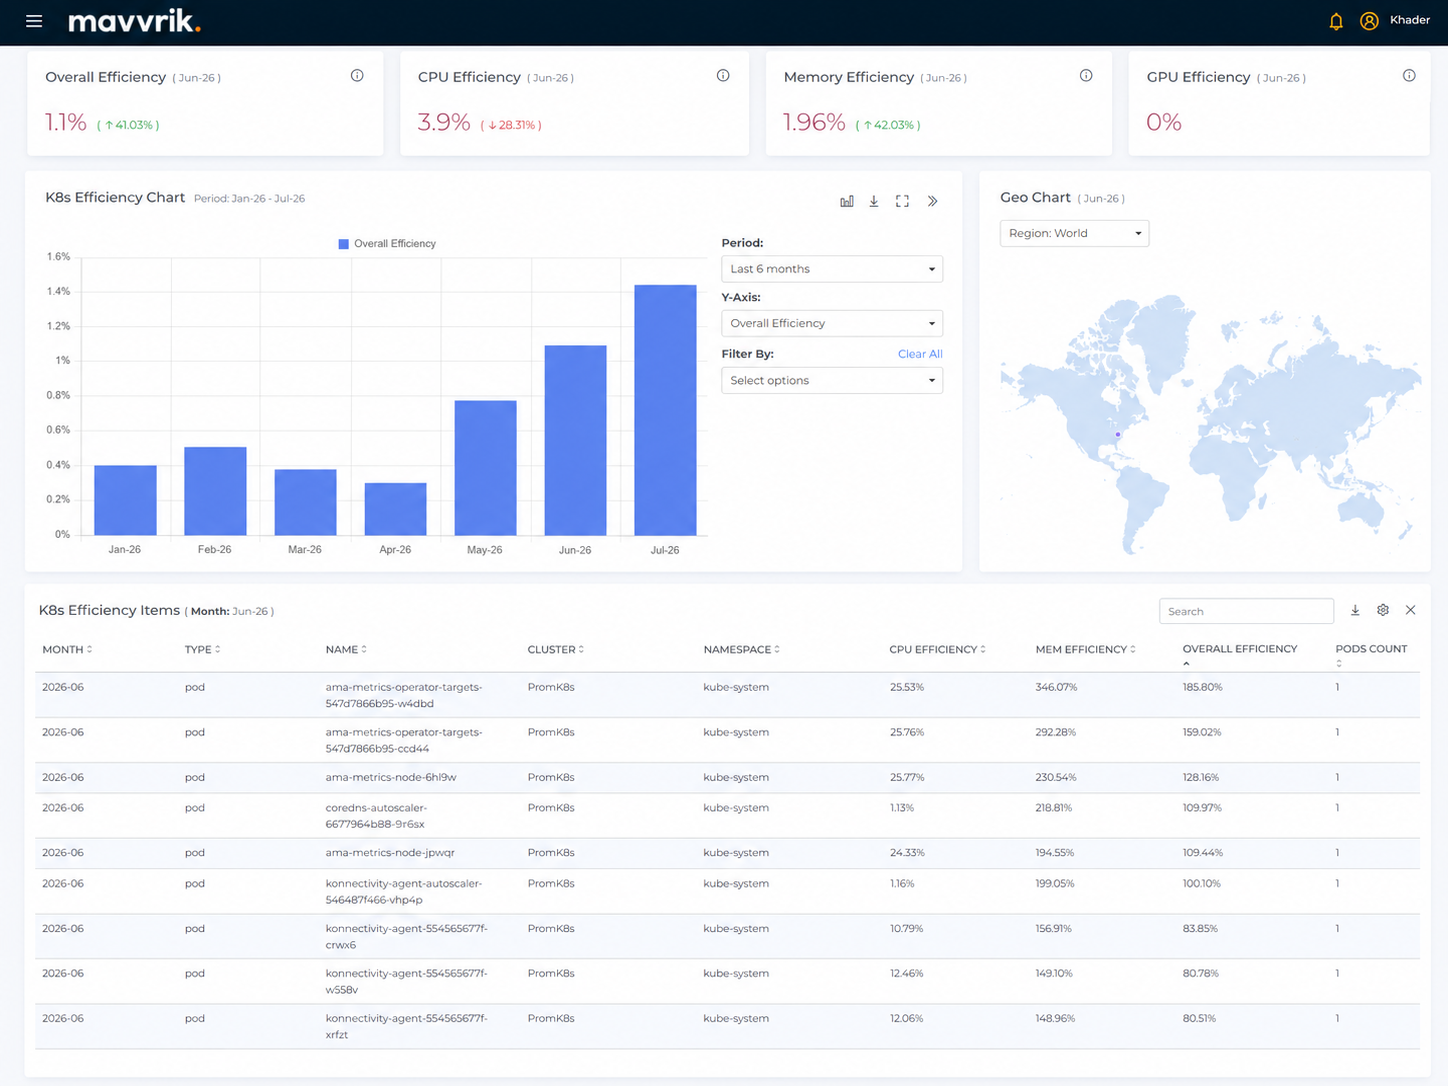
Monitor Kubernetes efficiency across CPU, memory, and GPU usage in one dedicated view.
The K8s Efficiency Dashboard shows how efficiently Kubernetes resources are used across clusters, namespaces, and workloads. Scorecards, charts, and detailed line items surface overall efficiency alongside CPU, memory, and GPU efficiency. Track trends over time, filter and group the data to analyze it from different angles, and drill into records to find where resources are underutilized or over-provisioned.
This gives FinOps, platform, and engineering teams a clearer way to spot optimization opportunities and support resource planning across containerized environments.
Savings Dashboard Enhancements
Improve recommendation review, tracking, and Azure savings coverage.
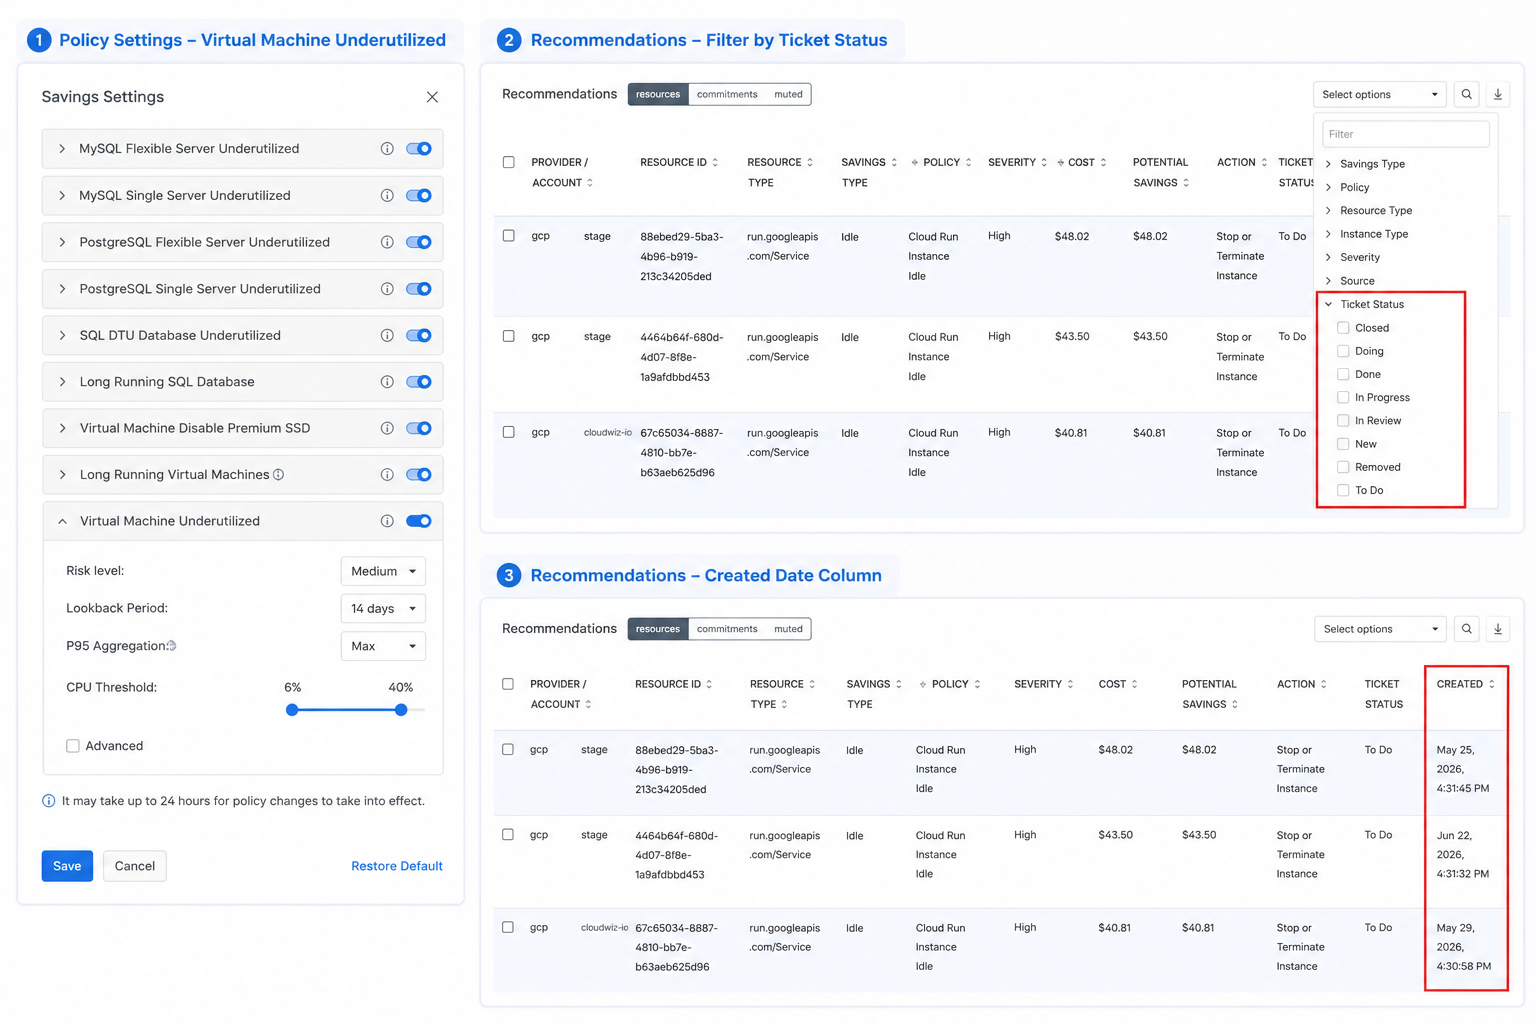
Filter by Open Tickets Filter savings recommendations by Open Tickets to focus on items that already have active follow-up work in progress, making it easier to track remediation and avoid duplicate tickets.
Generated Date on Recommendations Recommendations now show the date they were created, so you can gauge freshness and prioritize the most recent opportunities.
New Azure Policy: Virtual Machine Underutilized Support has been added for the Azure savings policy Virtual Machine Underutilized, expanding Azure coverage and flagging virtual machines that may be candidates for rightsizing or optimization.
Cost Allocation Enhancements
Allocate shared costs more precisely and track segment trends over time.
Cost Allocation now gives you finer control over how shared costs are distributed and clearer visibility into how allocated costs change month to month.
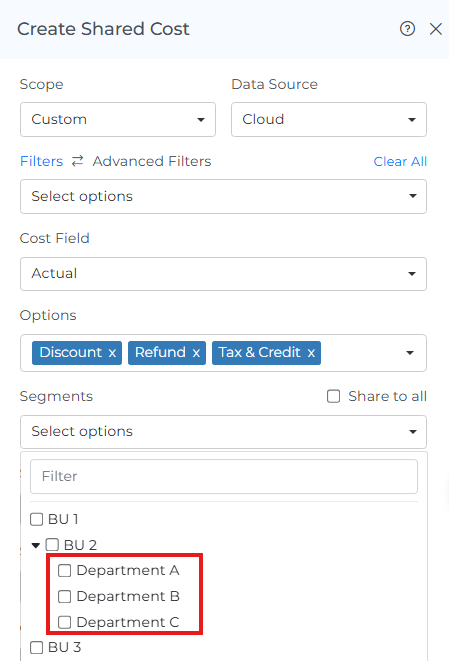
When creating a shared cost, you can now split it across multiple selected segments rather than the entire group. Expand a group to auto-discover its child segments and select only the ones you need, the shared cost is then distributed proportionally to each selected segment's cost.
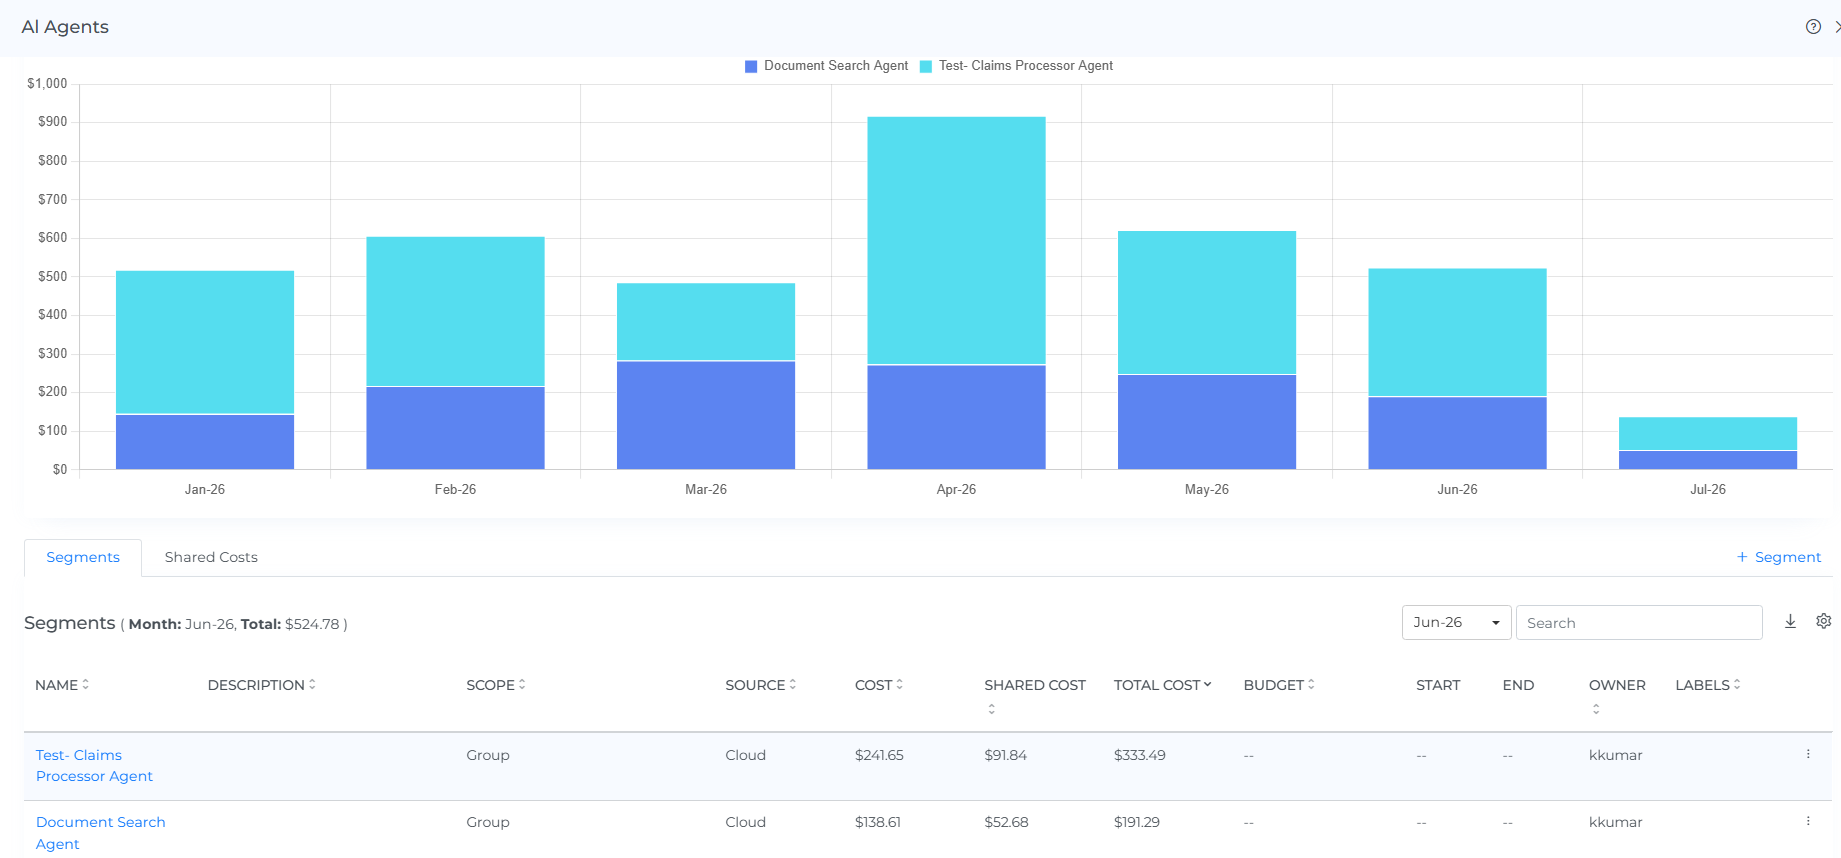
You can also review month-over-month cost trends for Cost Allocation segments, making it easier to understand how allocated costs change across each segment level during allocation reviews.
Platform Enhancements
Dashboards : Chart, Table, and Export Enhancements
Dashboard charts and tables now give you more complete cost visibility.
Others Grouping
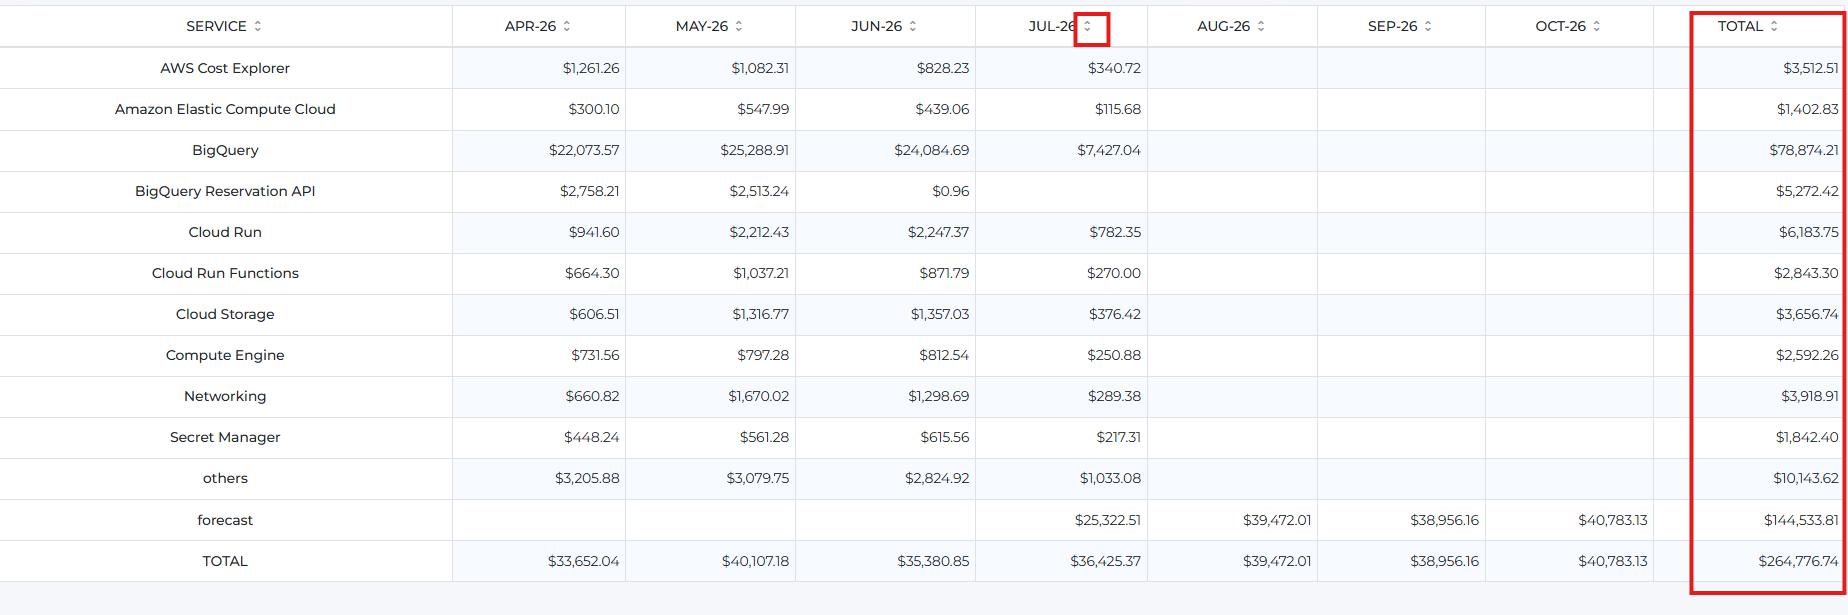
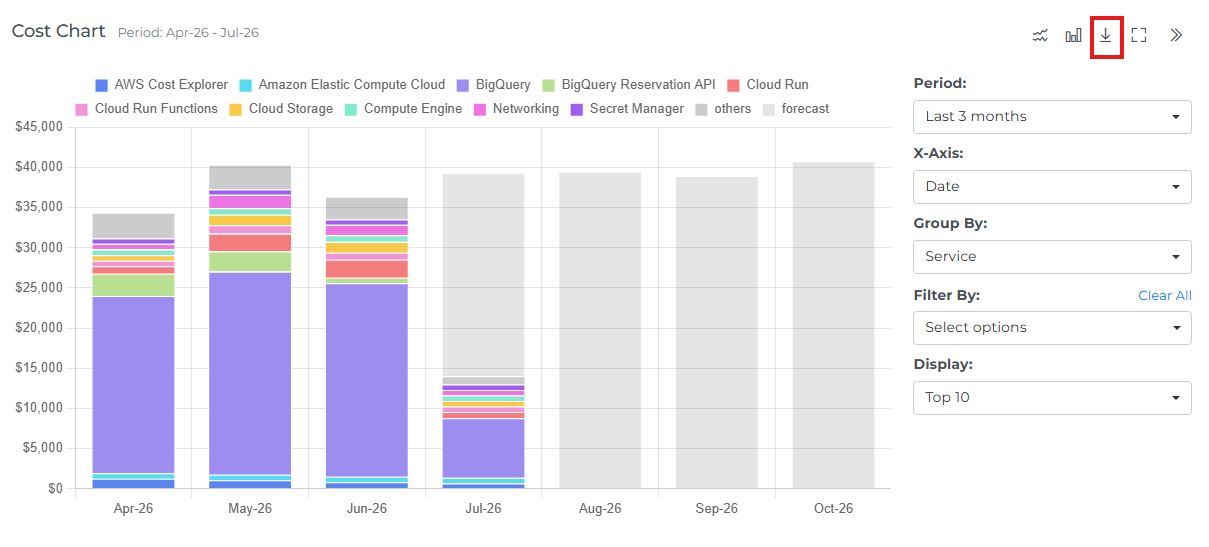
Smaller contributors are rolled up into an Others group in both the chart and the main table, so totals stay complete without cluttering the view.
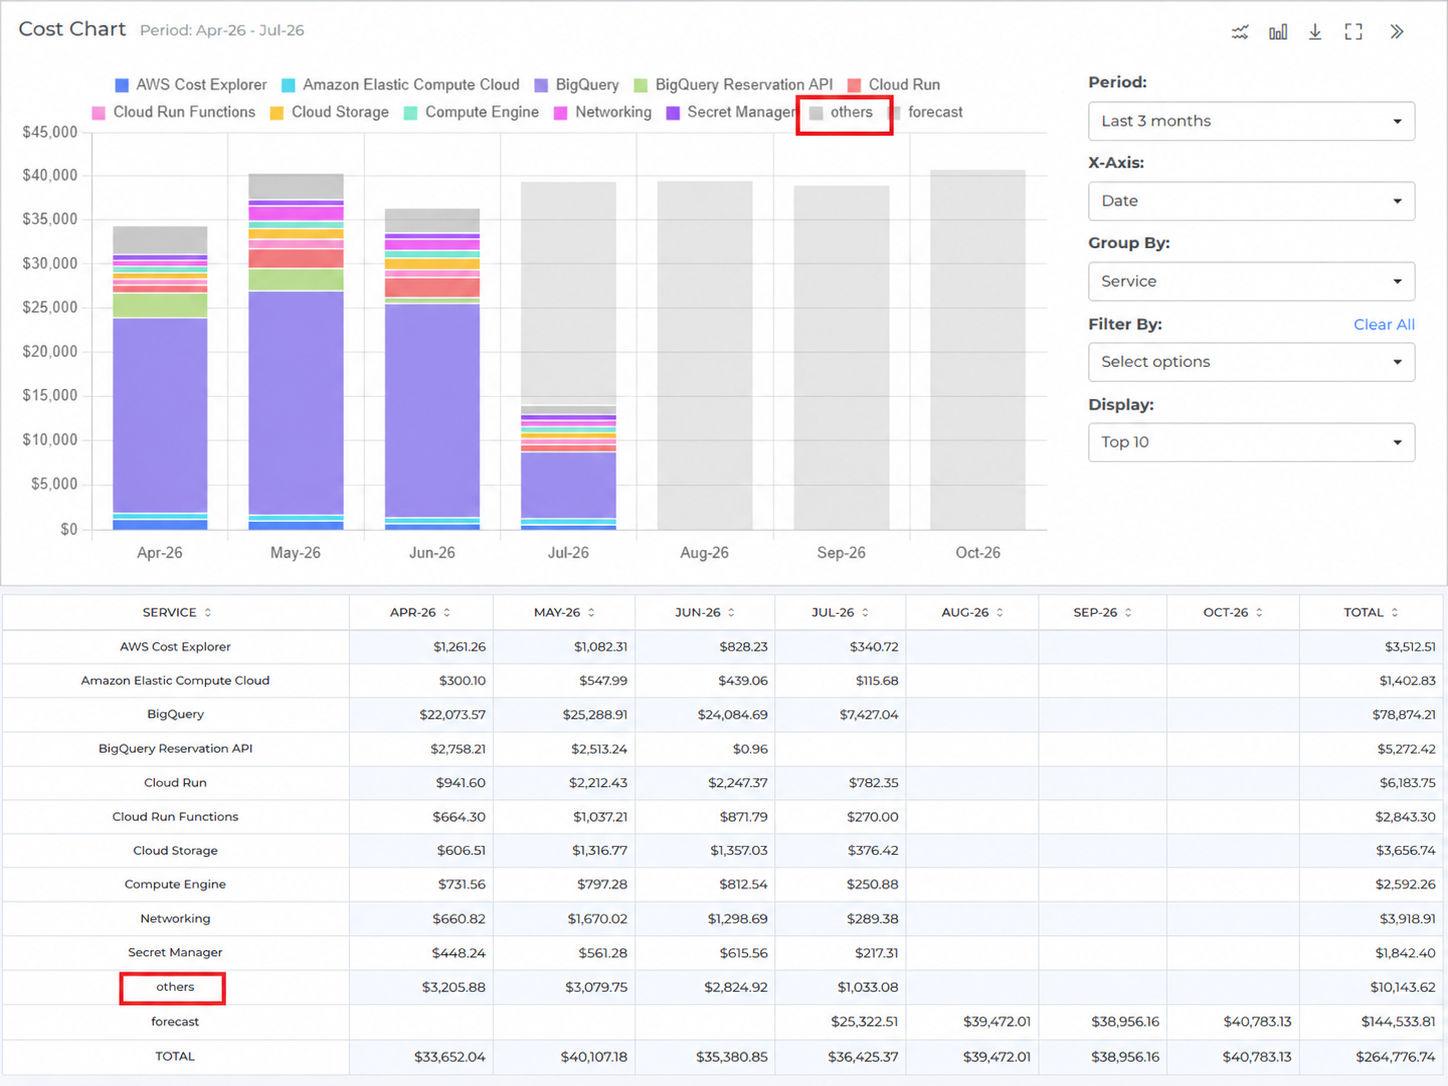
Table Enhancements
The main table now includes a Total column for each service's total across all periods, plus column sorting on every column — sort by service, any month, or total to quickly surface your largest or smallest cost areas.
CSV Export
Download the full dataset directly from the chart toolbar for offline analysis or reporting.
SaaS CSV Connector : Expanded Details Panel
The SaaS CSV Connector details panel now includes all columns uploaded through the CSV file, giving you a more complete view of imported SaaS cost and usage data.