.png)
Forecast Planner
Forecast → New Forecast
The Forecast Planner lets you create a baseline forecast, apply adjustments, and lock the adjusted forecast so you can compare it against actual spend over time.
Why this matters: a forecast that just extrapolates historical trend misses anything you already know is coming: a new project launching, a planned migration, a commitment expiring. The Adjustment layer is what lets you fold that known-future context into the forecast, and locking it means you're tracking against a plan you actually committed to, not a number that silently drifts as new data comes in.
You can:
-
Build a forecast from historical data
-
Add adjustment events (increase/decrease)
-
Lock the adjusted forecast
-
Track Actual vs Forecast vs Adjusted Forecast
-
View saved forecast tracking from Forecast list
1. Create a new Forecast
Go to Forecast → + Forecast. This opens the Forecast Planner (a single screen where the Name and Description fields sit at the top, alongside the Setup and Adjustment tabs and the Forecast Chart/Table below). There's no separate save step before you reach Setup: you name the forecast, configure it, and click Save once at the end.
Enter:
-
Forecast name: (e.g. Cloud Q2 Forecast)
-
Description: optional
2. Configure Forecast Setup
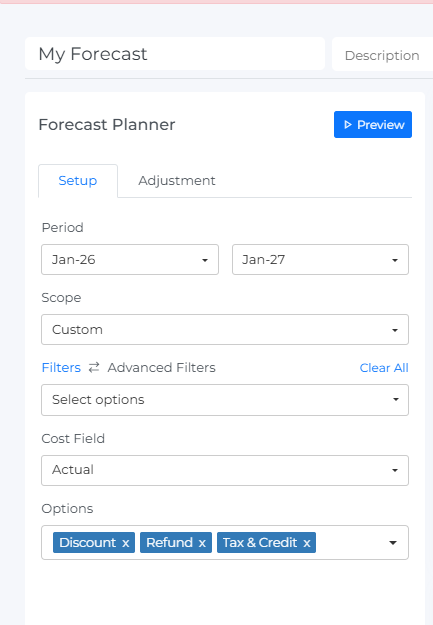
In Forecast Planner → Setup
Period
Select forecast time range:
-
Start month
-
End month
Example:
Dec-25 → Dec-26
Scope
Choose what the forecast applies to:
-
All Cloud
-
Custom
-
Perspective
Filters (Optional)
Narrow the forecast to specific data. There's a Filters / Advanced Filters toggle above the field list:
Filters (basic) gives you a flat list of dimensions to check off. The full list of filterable dimensions is:
-
Provider
-
Billing Account
-
Usage Account
-
Resource Group
-
Category
-
Location
-
Service Category
-
Service
-
SKU
-
Cost Type
-
Billing Entity
-
Instance Type
-
Virtual Tag Key
-
Tag Key
Advanced Filters lets you build detailed conditions instead — select a dimension, choose an operator (e.g. "IN"), and pick values, with + Filter to add more conditions and + Group to nest a set of conditions together. Apply or Cancel your changes, or use Clear All to reset.
These filters apply to the whole forecast, not to individual adjustment events (see Section 5).
Cost Field
Choose cost type:
-
Actual
-
Net Actual
-
Amortized
-
Net Amortized
Options
Include or exclude cost components:
-
Discount
-
Refund
-
Tax & Credit
Click Preview to generate forecast.
3. Forecast Chart
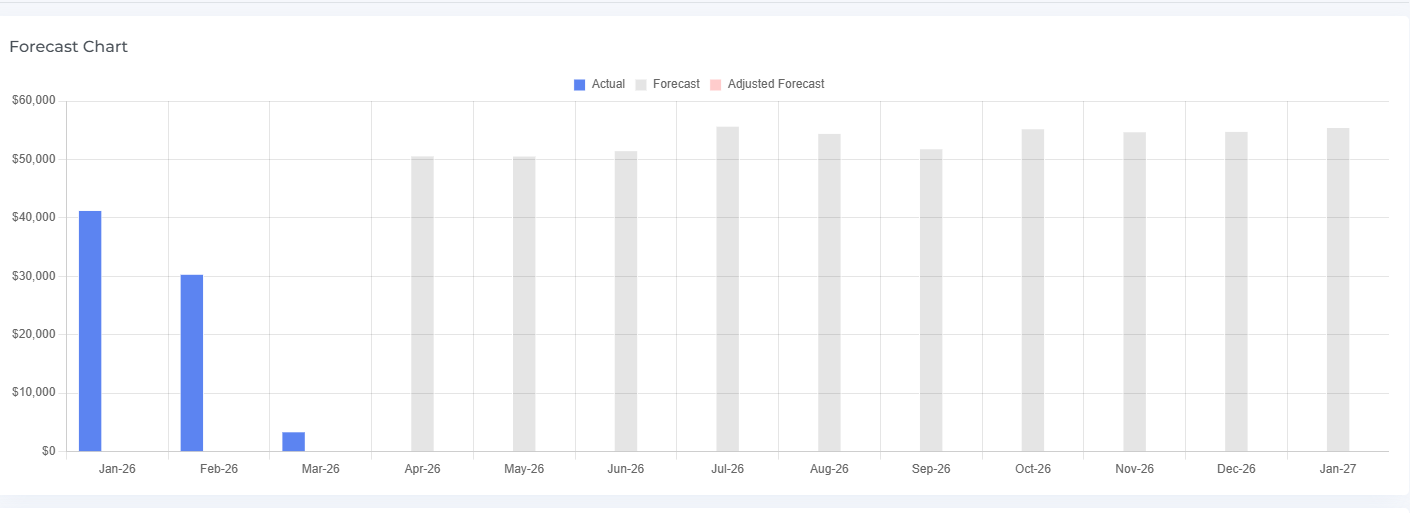
The chart displays:
-
Actual: historical spend (blue)
-
Forecast: predicted spend (gray)
-
Adjusted Forecast: appears after adjustments
Use this to:
-
Compare past vs predicted
-
Visualize adjustments
-
Identify spikes or drops
4. Forecast Table
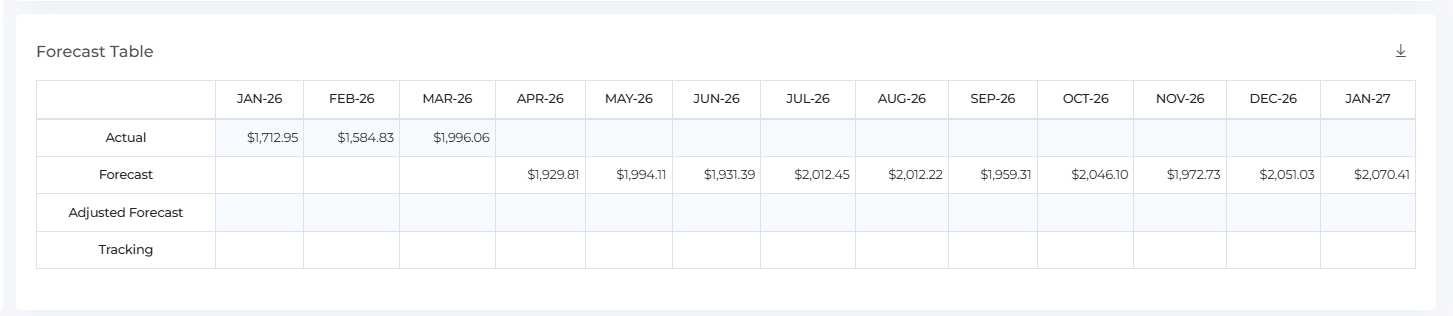
The table shows monthly values:
|
Row |
Description |
|---|---|
|
Actual |
Historical spend |
|
Forecast |
System generated forecast |
|
Adjusted Forecast |
Manual adjustments |
|
Tracking |
% spent vs forecast |
5. Adjust the Forecast
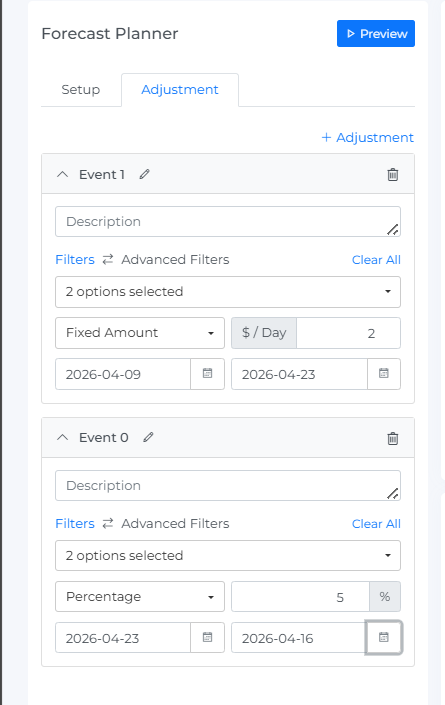
Go to Forecast Planner → Adjustment
Click + Adjustment
Each event includes:
Description
Reason for adjustment
Example: New project launch
Adjustment Type
Choose:
-
Fixed Amount $ / Day
-
Percentage %
Date Range
Select start and end dates
Example:
$5,000 from Apr-26 to Jun-26
You can create multiple events. Each event applies to the whole forecast for its date range: adjustment events don't have their own filters; to scope the forecast itself to a subset of data (e.g. one provider or account), use the Filters on the Setup tab instead.
6. Lock Forecast
Click Save
This locks:
-
Forecast
-
Adjusted Forecast
System now tracks Actual vs Locked Forecast
7. View Created Forecast
After saving, go to:
Forecast → Manage Forecast
This page lists all forecasts with:
-
Name
-
Description
-
Scope
-
Source
-
Tracking %
-
Owner
-
Created date
Each row also has Clone, Edit, and Delete action icons for managing that forecast: Edit and Delete only appear on forecasts you own; for forecasts owned by someone else, only Clone is available.
Tracking bar shows:
Actual vs Forecast consumption

8. Forecast Details View
After clicking a forecast, the system opens the Forecast View page.
This page shows:
Forecast Chart
Displays:
-
Actual spend
-
Forecast values
-
Trend comparison
Helps visualize:
-
How actual compares to forecast
-
Monthly spend trajectory
Forecast Table
Shows:
-
Monthly Actual values
-
Forecast values
-
Tracking percentage
Use this to:
-
Compare actual vs forecast
-
Monitors spend progress
-
Validate forecast accuracy
9. Common Use Cases
Lock quarterly forecast
Create → Adjust → Save → Track
Compare actual vs planned
Open forecast from list view
Monitors spend progress
Use tracking bar
Forecast upcoming growth
Add adjustment events
Troubleshooting
-
If you can't change a forecast's scope or filters, check whether it's already been locked; a locked forecast tracks against a fixed plan, so a scope change means creating a new forecast instead.
-
If an adjustment doesn't show up in the Adjusted Forecast, confirm you clicked Save after adding the event; adjustments only take effect once saved.
-
If you don't see Edit or Delete on a forecast in the list, check the Owner column: only the forecast's owner sees those actions; everyone else only sees Clone.
FAQs
What happens when I lock a forecast?
Both the Forecast and Adjusted Forecast values become fixed, and the system starts tracking Actual spend against that locked number, so you're comparing to a plan you committed to, not a number that could silently drift as new data comes in.
What's the difference between a Fixed Amount and a Percentage adjustment?
Fixed Amount adds a set dollar value per day across the selected date range. Percentage instead scales the forecast up or down by a percentage over that same range.
Can I apply an adjustment event to just one provider or account?
No, adjustment events apply to the whole forecast for their date range. To scope the forecast itself to a specific provider, account, or other dimension, use the Filters on the Setup tab before generating the forecast.
Why can I only Clone some forecasts in the list, not Edit or Delete them?
Edit and Delete are only available on forecasts you own. For forecasts created by other users, you can still Clone them to make your own copy, but not modify or remove the original.