.png)
Savings Overview
This dashboard provides a centralized view of potential cost-saving opportunities across your cloud and infrastructure resources. It helps you identify and act on savings recommendations related to orphaned, idle, or underutilized resources, as well as rightsizing suggestions. Users can review detailed recommendations, adjust policy settings, track estimated savings, and take actions such as ticket creation, muting, or committing to savings plans. Advanced filters, detailed metrics, and flexible reporting tools make it easy to prioritize, analyze, and optimize cost-saving actions across providers.
Why this matters: a recommendation is only useful if someone actually reviews and acts on it — and the volume of resource-level recommendations across a real environment is usually too high to review one by one manually. The policy settings, thresholds, and bulk/combined ticket creation on this page exist specifically to make that volume manageable: filter out low-value recommendations, route the rest to the right team, and close the loop from "here's a recommendation" to "here's a ticket someone owns."
This shows up differently depending on your role:
-
FinOps managers use Threshold Settings and Multiple Savings Policy Settings to make sure the recommendations surfaced are actually worth someone's time, filtered to the accounts or business units that matter.
-
Engineering leads use Combined Ticket creation to turn a batch of related recommendations into a single ticket their team can action, rather than fielding dozens of individual tickets.
Want to understand how recommendations are generated?
For details on the criteria, lookback periods, thresholds, metrics, and suggested actions used for savings recommendations, see How Savings Recommendations are Generated
How Potential Savings Is Calculated
The potential savings figure for a resource is based on its cost across the last two invoice months — in practice, the current month and the previous month — and we take the higher of the two, not just the current month's figure.
This is intentional, for two reasons:
-
It surfaces the maximum realizable savings. The recommendation should reflect the largest amount you can actually save by acting on it, so we take the higher of the two months rather than whichever one happens to be more recent.
-
A current-month-only figure is unreliable early in the month. At the start of a billing period, accrued cost is still near zero, so anchoring purely to the current month would understate — or effectively zero out — the potential savings. Taking the max of the two months keeps the number stable and meaningful throughout the entire month.
So if you see a recommendation referencing last month's cost instead of this month's, that's this logic working as intended — it's picking whichever of the two months had the higher cost, not defaulting to current-month-only.
Savings Categories
Cost Savings
The cost-saving widget shows the total potential savings for various resources. By clicking on a specific cost, users can access recommendations for how to achieve those savings and view relevant data. These recommendations are displayed in accordance with the cost that was clicked. The widget helps users identify opportunities to reduce costs and increase efficiency by identifying areas where changes or improvements can be made.
Orphan Resources
The orphan resources widget shows the number of recommendations for various orphaned resources. By clicking on a specific orphan recommendation, users can view data and further recommendations for managing that resource. These recommendations are displayed in accordance with the orphan recommendation that was clicked. The widget helps organizations identify and address orphaned resources, allowing them to optimize their use of resources and avoid waste.
Idle Resources
The idle resources widget shows the number of recommendations for resources that are not currently in use. By clicking on a specific idle recommendation, users can view data and further recommendations for managing that resource. These recommendations are displayed in accordance with the idle recommendation that was clicked. This widget can be helpful for organizations looking to optimize their use of resources and improve efficiency by identifying and addressing resources that are not being utilized.
Rightsize Resources
The rightsize resources widget provides recommendations for underutilized resources. By clicking on a specific recommendation, users can view data and further recommendations for managing that resource. These recommendations are displayed in accordance with the recommendation that was clicked. This widget can be useful for organizations looking to optimize their use of resources and reduce costs by identifying and addressing resources that are not being utilized to their full potential.

Commitments
The Commitments widget shows the total potential savings available from Reserved Instance and Savings Plan recommendations, for the commitment term currently selected under Cost Options (1 Year or 3 Years — see Commitment Tenure below). Clicking it filters the Recommendations table to the commitments view. Unlike the other four widgets, its heading shows both the data snapshot and the selected term, e.g. "Commitments ( Latest, 3 Years )".
Settings and Recommendations
Cost Field and Savings Field — what they control
These two settings both change how cost figures are calculated across the page, but they answer different questions:
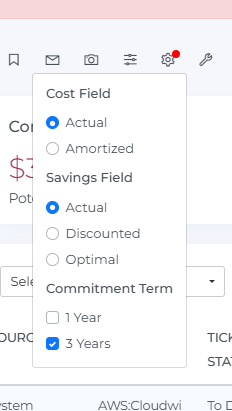
Cost Field controls how your current spend is shown:
-
Actual — your real, on-demand billed cost, with any Reserved Instance or Savings Plan discount broken out as its own separate line item. Use this when you want to see exactly what each commitment discount is worth.
-
Amortized — spreads the cost of any Reserved Instances or Savings Plans evenly across the commitment period, so the discount is baked into a single normalized monthly number instead of shown separately.
Savings Field controls how the potential savings on a recommendation is calculated:
-
Actual — the saving measured against full on-demand pricing, as if no discounts existed. This is the largest of the three numbers whenever a resource has existing commitment coverage.
-
Discounted — for AWS, this is AWS's own after-discount savings estimate (from AWS Compute Optimizer), taken as-is rather than calculated by Mavvrik — it reflects what AWS itself determines you'd save after accounting for your Reserved Instances or Savings Plans. Currently available for AWS only — Azure and GCP don't provide an equivalent discount-aware savings figure from their own recommendation engines, so Discounted shows the same value as Actual for Azure and GCP resources.
-
Optimal — the saving if the recommended change delivered its full relative benefit against what you're really paying today, rather than against on-demand list price. Usually the most optimistic of the three figures, landing above Discounted but below Actual.
How they relate: Cost Field and Savings Field are independent settings — changing one never changes the other. Actual reflects list/on-demand pricing on both. Amortized (Cost Field) and Discounted (Savings Field, AWS only) both reflect your real, already-discounted spend. Optimal also uses that real-spend baseline, but projects the recommended change's full relative benefit onto it rather than subtracting costs directly.
Quick example (AWS EC2 rightsizing): A VM costs 500 per month on-demand, but a Reserved Instance brings the real monthly cost to 350. A recommended resize would bring the on-demand cost down to 200 per month.
-
Actual savings: 500 minus 200 = 300 per month
-
Discounted savings: AWS's own after-discount estimate, here approximately 150 per month
-
Optimal savings: 350 × (1 − 200/500) = 210 per month
Note: this worked example reflects AWS behavior, where Discounted is computed independently of Actual. For Azure and GCP, Discounted savings will currently equal Actual savings.
You can filter recommendations by Commitment Term, which supports 1 Year or 3 Years options. Selecting 1 Year displays 1-year recommendations, selecting 3 Years displays 3-year recommendations.
Cost Field, Savings Field, and Commitment Term are fully independent of each other. Changing one never changes the value of another — for example, switching Savings Field between Discounted and Optimal, or switching Commitment Term between 1 Year and 3 Years, will never change your Cost Field selection, and vice versa. Each control stays exactly where you left it until you change it yourself.
Why this matters: if you're comparing Savings totals between two views — a dashboard, a saved bookmark, or a conversation with support — and the numbers don't match, the most likely cause is that one of these three settings was set differently in each place being compared, not a data error. Before investigating further, check that Cost Field, Savings Field, and Commitment Term are set the same way in both places you're comparing.
Viewing Historic Savings Recommendations
You can now view your Savings recommendations as they stood for any past month, not just your current, live data. This is available on both the Savings.
Overview
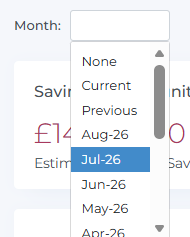
At the top of the Savings page, a Month dropdown lets you choose which point in time you want to view recommendations for:
|
Option |
What it shows |
|---|---|
|
None |
Your latest recommendations — a live snapshot of what we'd recommend right now. Summary cards are labeled "( Latest )" in this view. |
|
Current |
Recommendations for the current calendar month. |
|
Previous |
Recommendations for the most recently completed calendar month. |
|
A specific month (e.g. Jul-26) |
Recommendations exactly as they were generated for that invoice month, based on the resources and costs that existed at that time. |
When you select a month, the summary cards and the Recommendations table below all update together to reflect that month.
Why the numbers can look different between months
"Latest" (None) always reflects your most up-to-date recommendation data. A named month reflects a fixed historical snapshot for that period. It's expected for these to differ — for example, a resource recommended for rightsizing in June may have since been resized or removed entirely, so it won't appear under "Latest" anymore, even though it will still appear under "Jun-26."
If a resource has since been stopped, resized, or deleted, its recommendation still remains visible under the month it was originally generated for — so you can always look back and see what was recommended at the time.
Historic month data is available starting from your account's onboarding month. Months before that will show no recommendations, since historic snapshots weren't being collected prior to onboarding.
Savings Settings
Policies settings
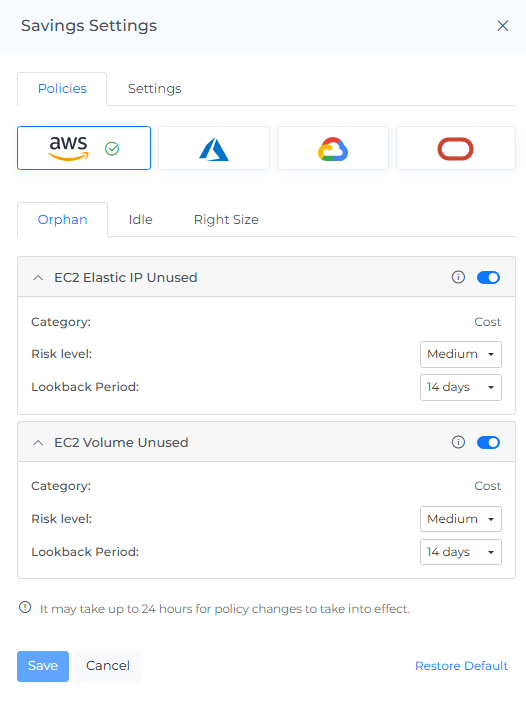
You can on/off the Settings of Recommendations.
You need to expand the particular policy to set Risk levels from dropdown & Threshold values by dragging the slider, then save the changes.
To set the default setting you need to click on the Restore default button, then save the changes.
Threshold settings
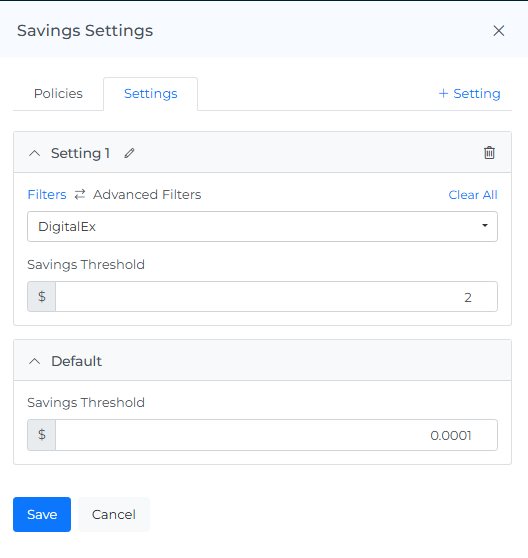
The Threshold Settings feature allows users to customize which savings recommendations appear by applying filters and setting a minimum savings threshold. If a threshold is defined (e.g., $100), any recommendations with potential savings below that amount will be excluded from the list. Users can create multiple settings with different filter combinations—such as billing accounts, usage accounts, or instance types—to control visibility and focus on high-impact savings opportunities.
A $1 minimum savings threshold applies by default. Out of the box, recommendations with potential savings below $1 are excluded from the list; everything at or above $1 is shown. This default lives under the "Default" scope on this panel and can be changed or removed by an admin at any time. If you're not seeing a recommendation you expect for a resource with very small savings potential (under $1), this default threshold — not a data issue — is almost always the cause. For anything at or above $1 that's still missing, check whether an admin has since configured a higher custom threshold for that scope.
Multiple Savings Policy Settings
You can now create multiple settings within a single savings policy to apply different rules to different targets such as cloud accounts, business units, environments, or user groups.
Each policy includes:
-
Default setting (applied when no custom rule matches)
-
One or more custom settings, each with its own basic/advanced filters and threshold values( You can add custom settings with filters to target specific resources.)
Settings are evaluated by priority order. You can reorder them, and the top setting has the highest priority. If no custom setting matches, the Default setting is applied.
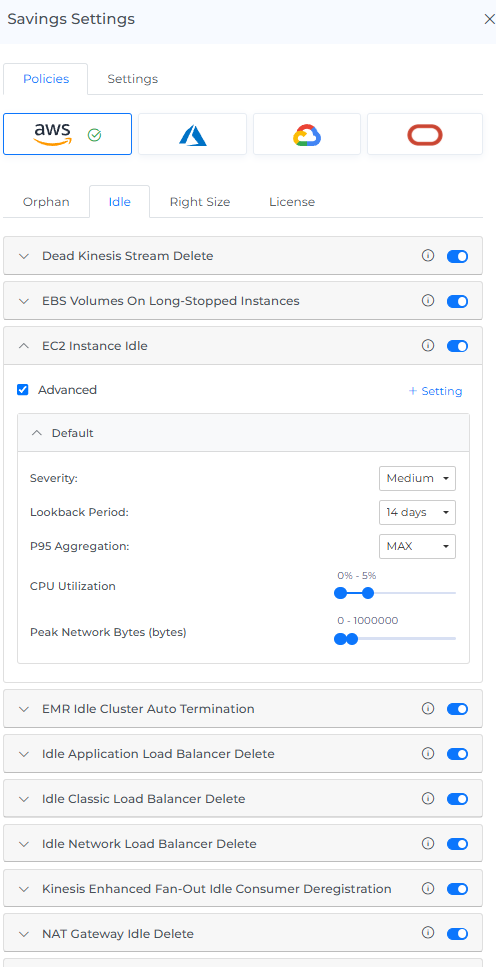
Each setting allows you to configure its own Lookback Period, enabling different optimization criteria for different resource settings.
Settings
Click the Settings (gear) icon in the page header to open Savings Settings, where you can enable or disable individual recommendation policies and adjust their thresholds — separately for each connected cloud provider (AWS, Azure, GCP, and Oracle Cloud Infrastructure) and category (Orphan, Idle, and Right Size).
Each policy shows its current Severity, Lookback Period, and the specific thresholds that trigger it — for example, Virtual Machine Idle uses a CPU threshold (e.g. 0–5%), measured against the lookback window using the aggregation you choose (Max, Min, or Average). Toggle a policy off if it doesn't apply to your environment, or adjust its thresholds to match your own definition of "idle" or "underutilized."
Click the info icon next to any policy to see a short description of what it flags and why — for example, EC2 Elastic IP Unused shows "Delete unused Elastic IPs on EC2 instances to save costs."
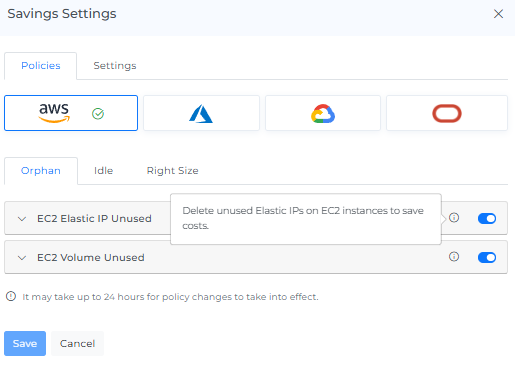
Policy changes can take up to 24 hours to take effect.
Recommendations
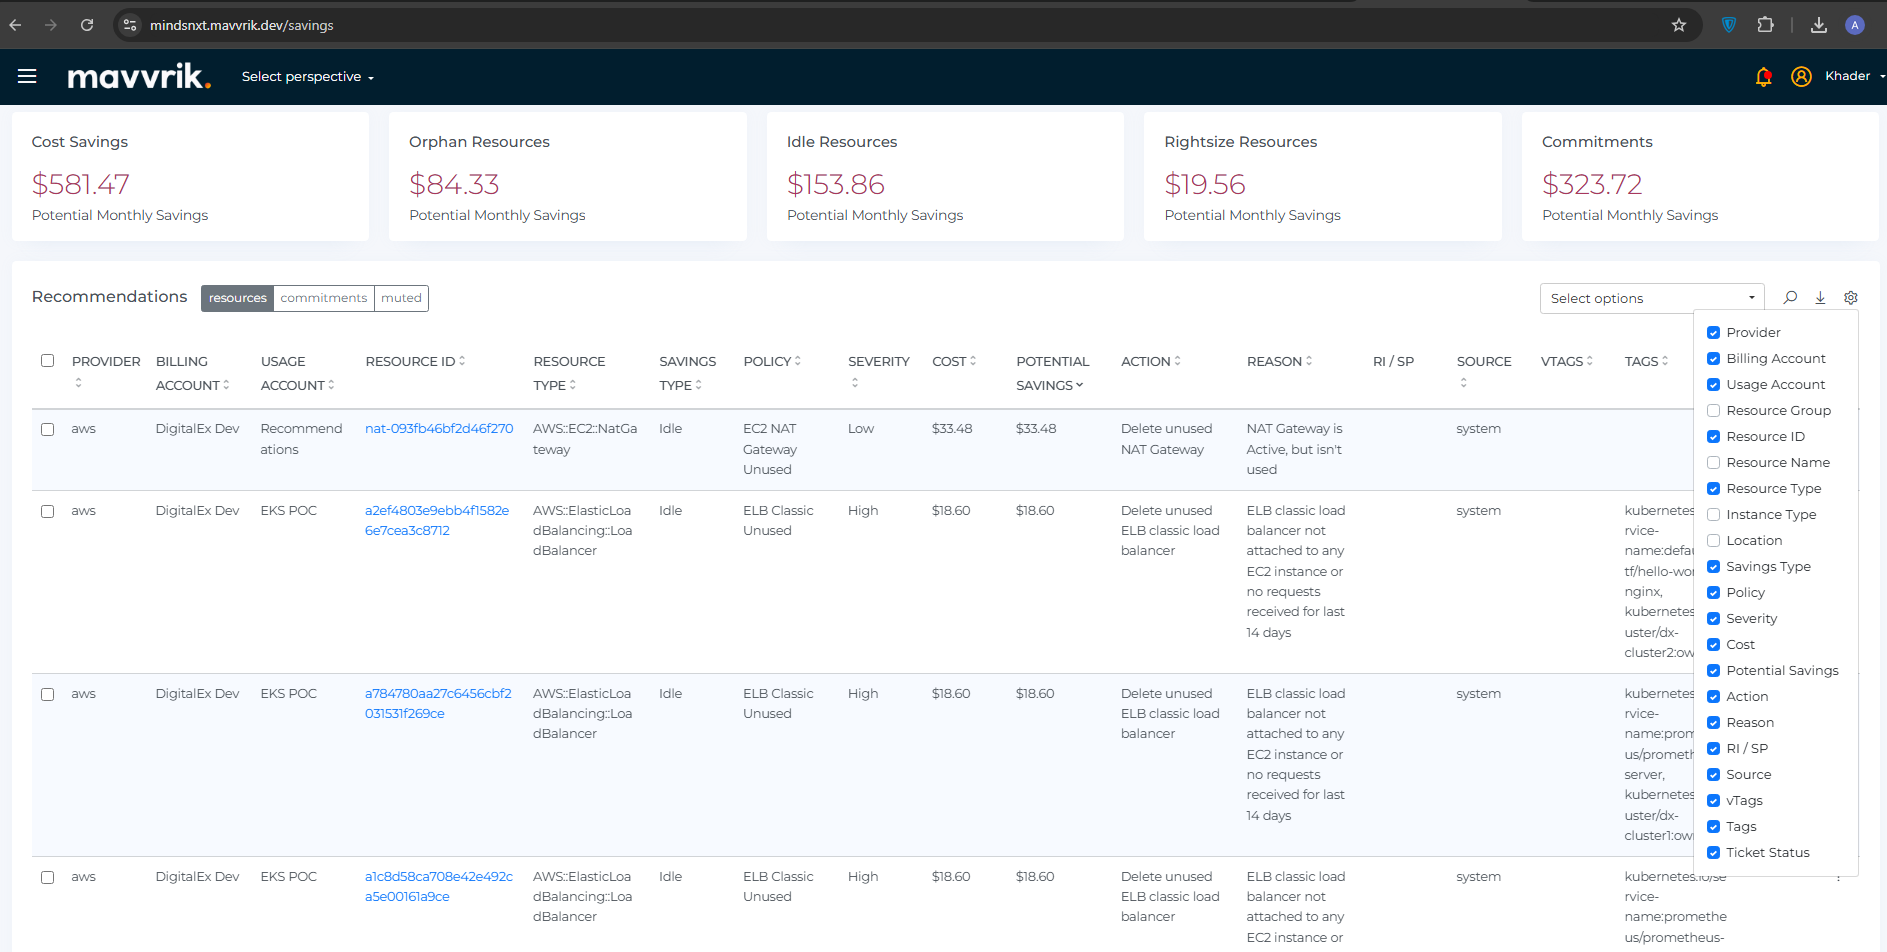
The recommendation list shows all recommendations across all providers, including AWS, GCP, and Azure. This feature allows users to view a comprehensive list of recommendations for optimizing their use of resources and reducing costs across all providers.
Above the table, three view tabs control what the table shows:
-
resources (default) — individual orphan/idle/rightsize resource recommendations.
-
commitments — Reserved Instance and Savings Plan recommendations, matching the Commitments summary widget.
-
muted — recommendations you've previously muted, so you can review or unmute them later.
You can select multiple rows by checking their respective checkboxes, and you also have the choice to mute all recommendations/commitments simultaneously using the select actions.
When you select the number of rows, you will be able to view that same quantity of rows on the page.
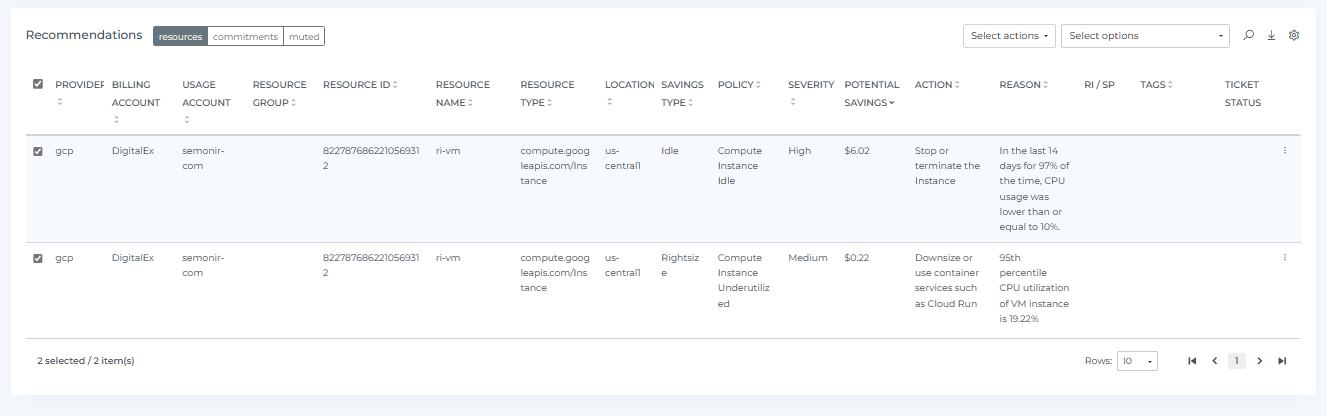
The recommendation table allows you to sort, search, and download the recommendations. You can also use the settings icon to change the way the recommendations are displayed in the user interface. The recommendations will be displayed according to the selected view. This feature provides users with flexibility and control over how they access and view the recommendations, making it easier for them to find and use the information they need.
You can differentiate between provider-native and Mavvrik-generated cost-saving recommendations using the Source column. If the source is provider, the recommendation comes directly from the cloud provider's own recommendation engine (this is what's sometimes referred to as a "Native" recommendation). If the source is system, the recommendation was generated by Mavvrik.
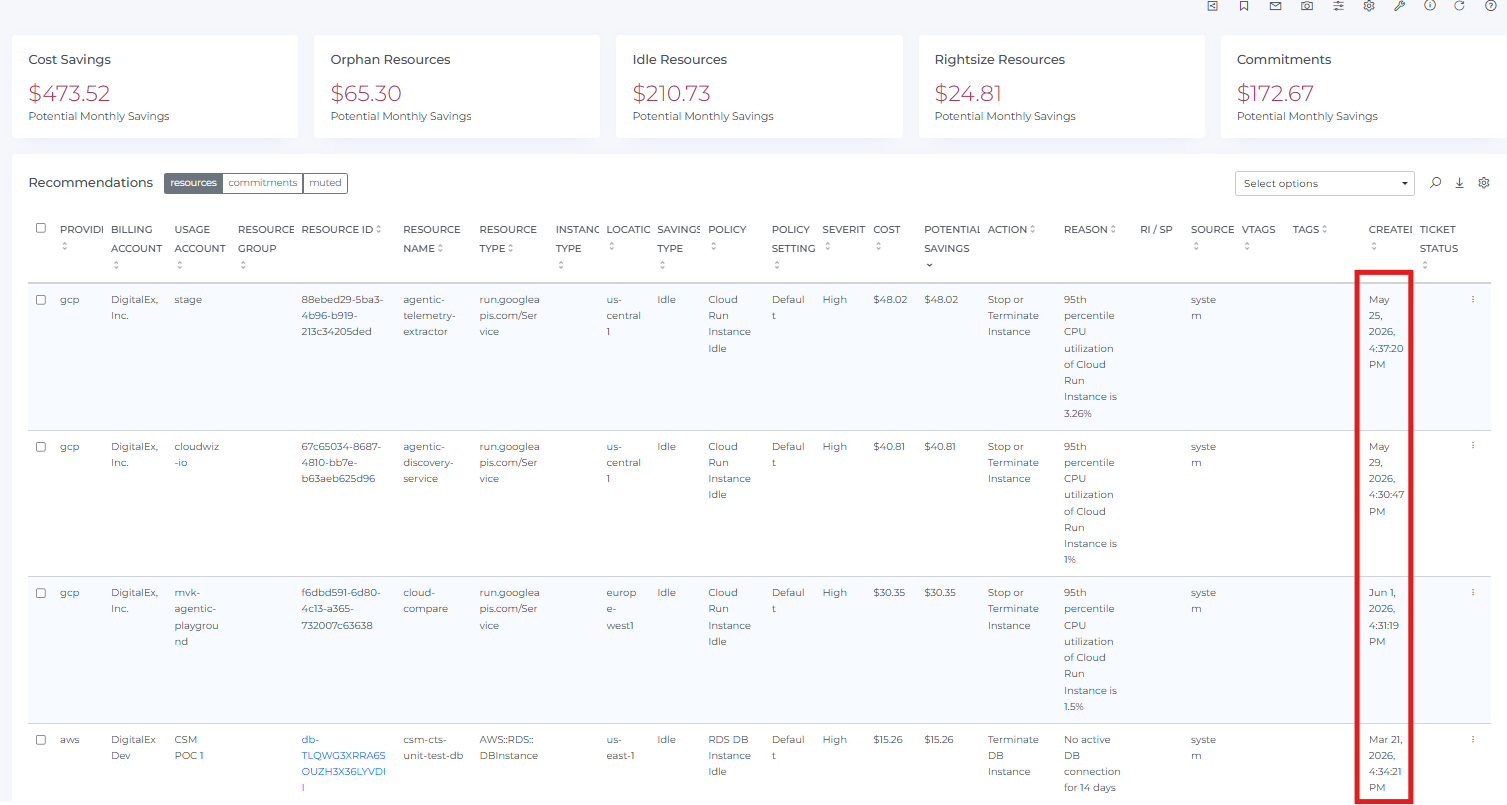
Created Date Indicates the date and time when the recommendation was generated by Mavvrik.
A new column on the Savings page shows which setting generated each recommendation, providing full visibility
Commitment Tenure
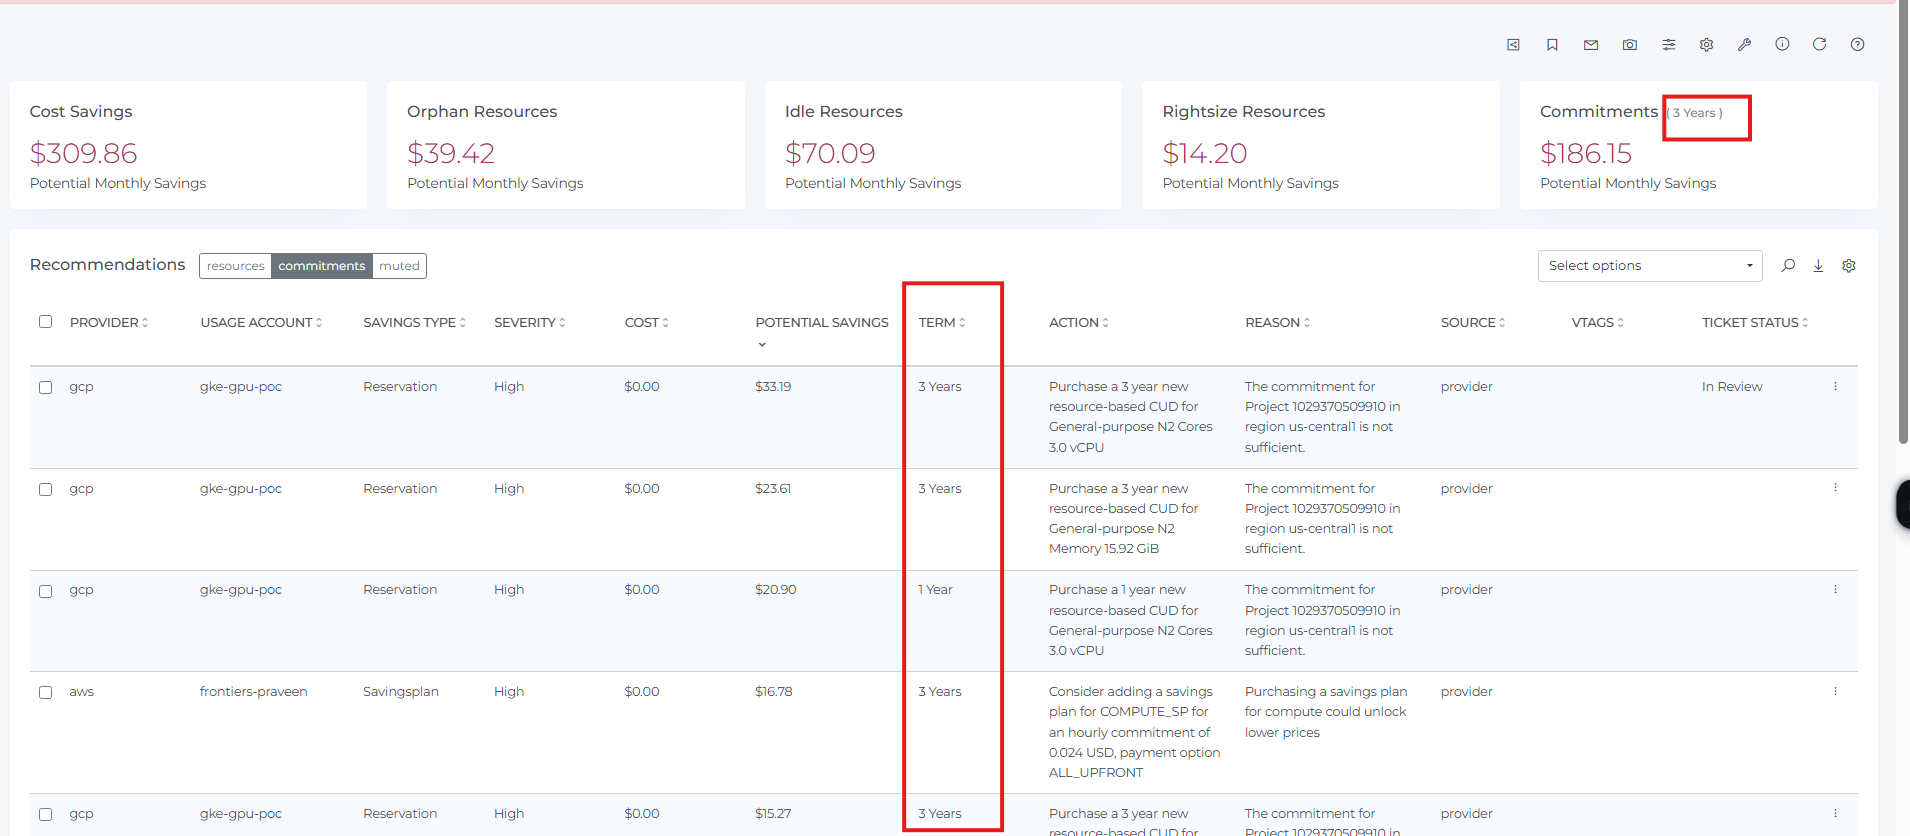
The Commitment Tenure option under Cost Options controls the commitment-related summary widgets at the top of the Savings page.
For example, when 3 Years is selected, the Commitments and Cost Savings widgets display the total commitment cost and potential savings associated with three-year commitments.
The commitments table is not restricted by this selection. It continues to display all available commitment recommendations, including both 1 Year and 3 Year terms. The applicable tenure for each recommendation is shown in the Term column.
This allows users to review all commitment opportunities in the table while using the tenure selection to compare the summarized cost and savings for a specific commitment term.
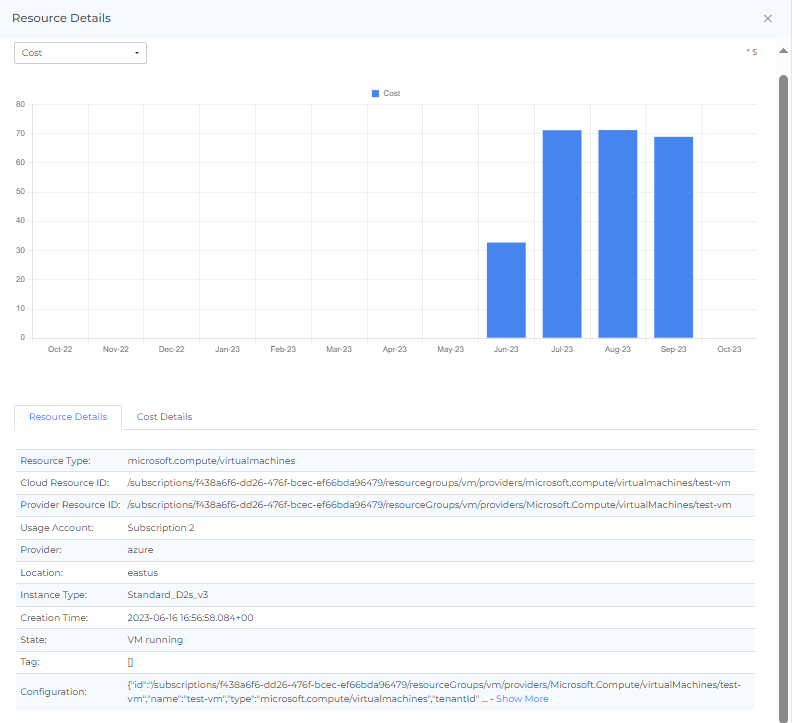
To access the Resource and Cost details, for that particular resource just click on the three dots located in the right corner of the resource, and then select "View Details." You can also hover the mouse over the bar to see the cost. This information can help you understand more about the resource and its associated costs.
Actions and Filters
Create / Update Ticket
To initiate the ticket creation process for that specific resource, simply click the three dots in the resource's upper right corner and choose "Create Ticket." If you've previously generated a ticket, you will find the "Update Ticket" option available.
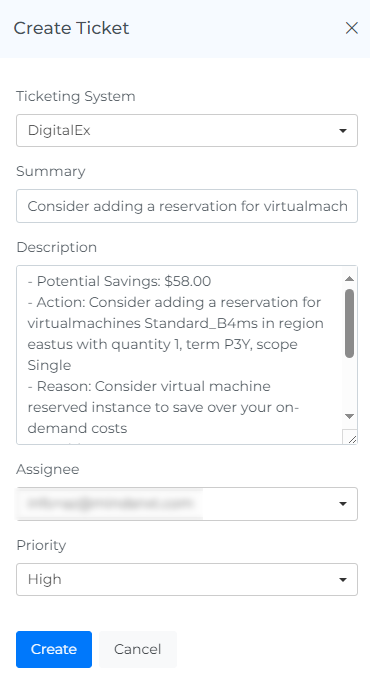
You can also generate multiple tickets at once by selecting multiple checkboxes.
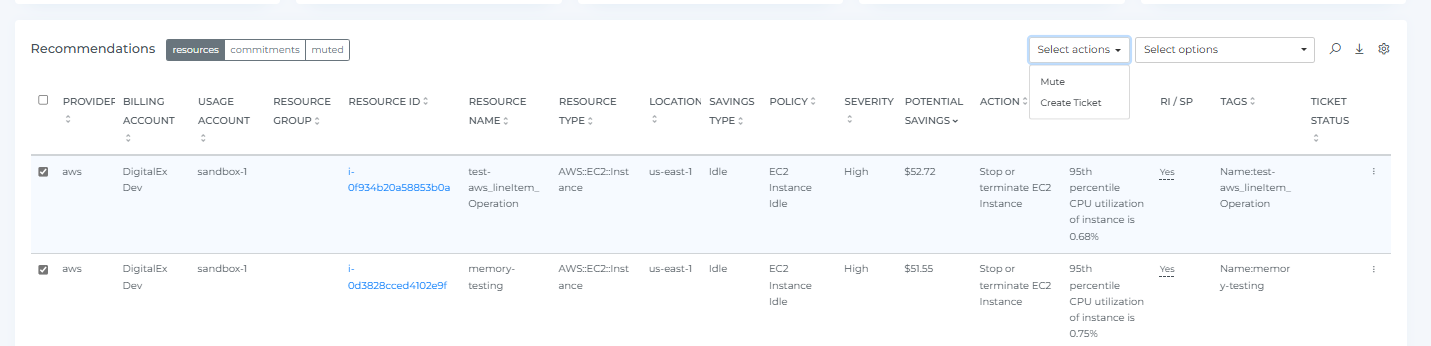
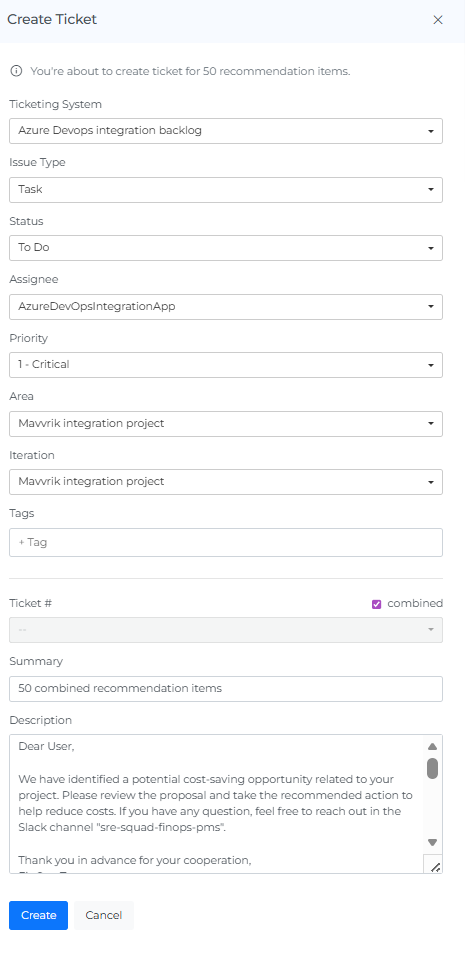
You can group multiple related recommendations into a single ticket. Select multiple recommendations and click Create Ticket to create a single ticket for all selected items.
This feature helps reduce ticket volume and allows teams to manage related recommendations or alerts from one ticket.
You can create individual tickets for up to 10 recommendations at a time.
If you select more than 10 recommendations, the message "Maximum of 10 tickets limit exceeded!" will be displayed.
To create a ticket for more than 10 recommendations:
-
Select the recommendations.
-
Open the Create Ticket dialog.
-
Enable the Combined checkbox.
-
A single ticket will be created containing all selected recommendations (for example, 25 or 50 recommendations).
The ticket summary will automatically display the number of recommendations included, such as "25 combined recommendation items" or "50 combined recommendation items".
Mute/Unmute Resources & Commitments
To begin muting specific resources or commitments, click on the three dots located in the upper right corner of the resource/commitment. From the menu that appears, select the "Mute" option. If you have muted these resources/commitments before, you will see the option to "Unmute." Muted items move to the muted view tab above the Recommendations table, rather than disappearing entirely.
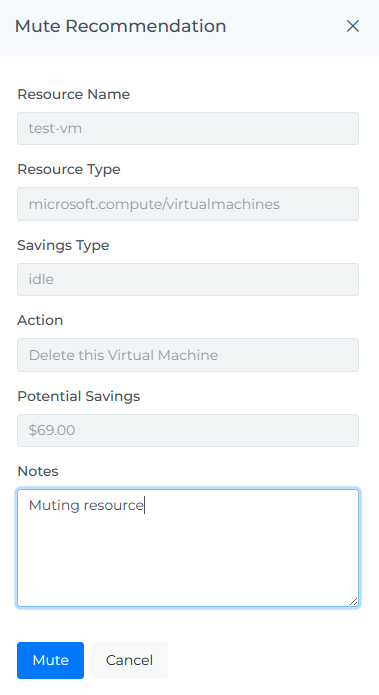
You can also mute multiple items at once by selecting their checkboxes.
Metrics
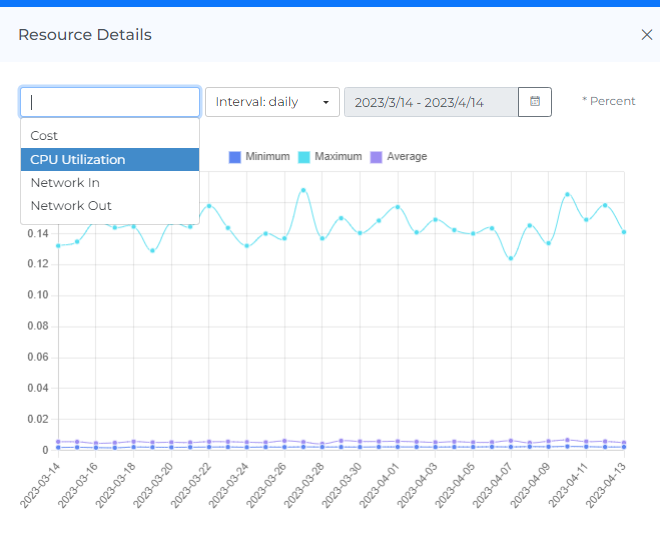
The monitoring graphs (Metrics) for different provider services allow users to see the usage and performance of these resources over time. By clicking on the three dots in the corner of the resource instance, users can access the metrics for that particular instance and change the metric type and intervals using the drop-down menu. They can also strikethrough to manage the statistics and hover the mouse over the dots on the line graph to see usage data for daily and hourly intervals. If the daily interval is selected, users can set the date range up to the last 30 days. This type of information can be useful for understanding how resources are being used and for identifying any potential issues or opportunities for optimization.
Share
If you click on the "share" link, a link to the current page will be copied to your clipboard. You can then share this link with other team members, allowing them to access the same data and filters as you. This can be useful for collaborating with others and sharing information about your Savings recommendations.
Savings Filters
Basic
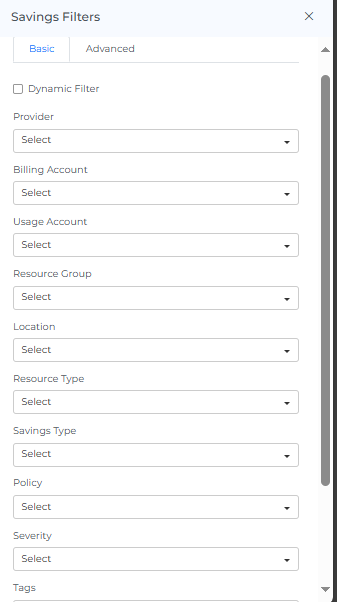
The filter option allows you to narrow down the data displayed on the page to specific criteria. You can use the filter to view Savings Page for a particular Billing Account, usage Account, Location, resource type & severity. This can help you focus on specific aspects of your Savings recommendations and more effectively analyze and understand the data.
On selecting Dynamic Filter adjusts options based on previous selections. For example, choosing a Provider will update subsequent filters (e.g., Billing Account, Usage Account) to show only relevant data for that provider. This ensures efficient and context-sensitive filtering.
Advanced
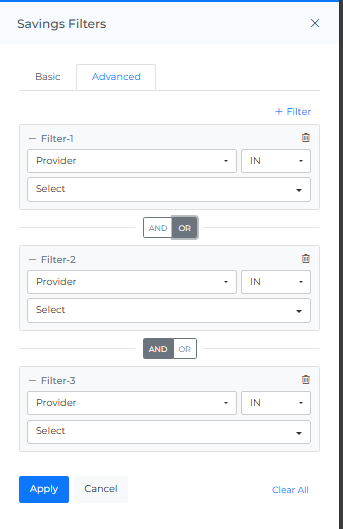
The "Advanced Savings Filters" feature use to apply detailed filters to refine search results. You can add multiple filters by selecting criteria like "Provider," choosing an operator (e.g., "IN"), and selecting values from dropdown menus. The interface includes options to apply or cancel changes and a "Clear All" button to reset filters.
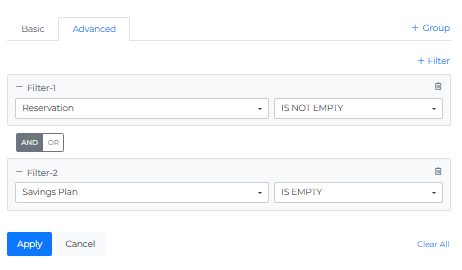
Advanced filter now supports Reservation and Savings Plan as filter fields, so you can see how your potential savings — across Cost Savings, Orphan, Idle, Rightsize, and Commitments — break down based on whether resources already have commitment coverage.Set the field to Reservation or Savings Plan, and choose Is Empty or Is Not Empty.Use Is Empty to focus on uncovered resources when planning new commitments, or Is Not Empty to review savings already realized through existing coverage.
Screenshot
If you click on the camera icon, you can take a screenshot of the current page and download it as a PDF file. This can be useful for saving a copy of the data or for sharing it with others.
Header Icons

Cost Options
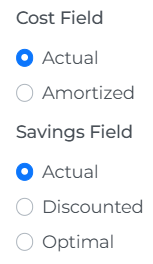
You can view costs by selecting different Savings field such as Actual, Discounted, Optimal
You can also choose a Cost Field like Actual, Amortized.
Hover over each option to see its meaning.
Reload Option
The "reset" option allows you to clear all filters and selections from the page, returning it to the default view. This can be useful if you want to start over or view the data in its original form.
Info
The "last updated" date and time stamp show when the data on the page was last refreshed. This can be useful for understanding the age of the data and determining if it is up to date.
Help
If you click on the "?" icon, you can access the help documentation for the page. This can provide you with additional information and guidance on using the page and its features.
FAQs
Why don't my Savings totals match between two views?
Cost Field, Savings Field, and Commitment Term are three fully independent settings. If they're set differently in the two places you're comparing, the totals won't match — that's almost always the cause, not a data error. Check that all three are set the same way in both places before investigating further.
Why wasn't a small savings opportunity flagged as a recommendation?
By default, a $1 minimum savings threshold applies — recommendations below $1 in potential savings are excluded. This default lives under the "Default" scope in Settings → Threshold and can be changed or removed by an admin. If the missing recommendation is at or above $1, check whether an admin has since set a higher custom threshold for that scope.
What's the difference between "system" and "provider" in the Source column?
"system" means the recommendation was generated by Mavvrik. "provider" means it came directly from the cloud provider's own recommendation engine (e.g. AWS Compute Optimizer) — this is what's sometimes called a "Native" recommendation elsewhere in the product.
What do the resources / commitments / muted tabs above the Recommendations table do?
They switch what the table shows: resources for individual orphan/idle/rightsize recommendations, commitments for Reserved Instance and Savings Plan recommendations, and muted for anything you've previously muted.