.png)
|
Release Highlights |
Mavvrik’s October 2026 release adds automatic connection of discovered AI accounts, support for agent telemetry sent from an OpenTelemetry Collector, ChatGPT Enterprise cost tracking, and GitHub cost tracking in the SaaS dashboard. It also extends allocated cost reporting to dashboards, adds external report delivery, and improves forecasting and alerting.
For more details, please reach out to your Mavvrik representative or check our updated documentation Help Center
|
Release Version |
Features |
|---|---|
|
Release-2026.10.15 |
FinOps for AI
New Integrations
Platform Improvements
|
FinOps for AI
Auto-connect for AI Accounts
Mavvrik now connects discovered AWS, Azure, and GCP AI accounts automatically, so that AI spend is tracked from the point of discovery rather than from the point at which someone remembers to connect the account. This covers newly discovered accounts and accounts that were discovered earlier but were never connected, which closes the gap in historical coverage that manual connection leaves behind. Accounts that you disconnected deliberately remain disconnected and are not reconnected.
Auto-connect is on by default. If you prefer to control connection yourself, you can turn it off at any time, and Mavvrik stops connecting newly discovered accounts from that point onward.
OpenTelemetry Collector Integration
Mavvrik now accepts agent telemetry forwarded from an OpenTelemetry Collector, so that you can track agent cost using the instrumentation you already operate rather than adding the Mavvrik SDK to your application code. You create an OpenTelemetry connection in Mavvrik, take the endpoint and the authentication details from it, and configure your existing Collector to send telemetry to that endpoint. This suits teams that already standardise on OpenTelemetry and cannot take an application code change to begin cost attribution.
When telemetry arrives, you verify the connection and review the agents that Mavvrik discovered, then select the agents that you want to connect. Connected agents appear in your Agentic Cost Governance views with model, token, usage, session, and metadata fields.
Mavvrik discovers an agent only when the forwarded telemetry carries enough identity information to distinguish that agent.
ChatGPT Enterprise Support
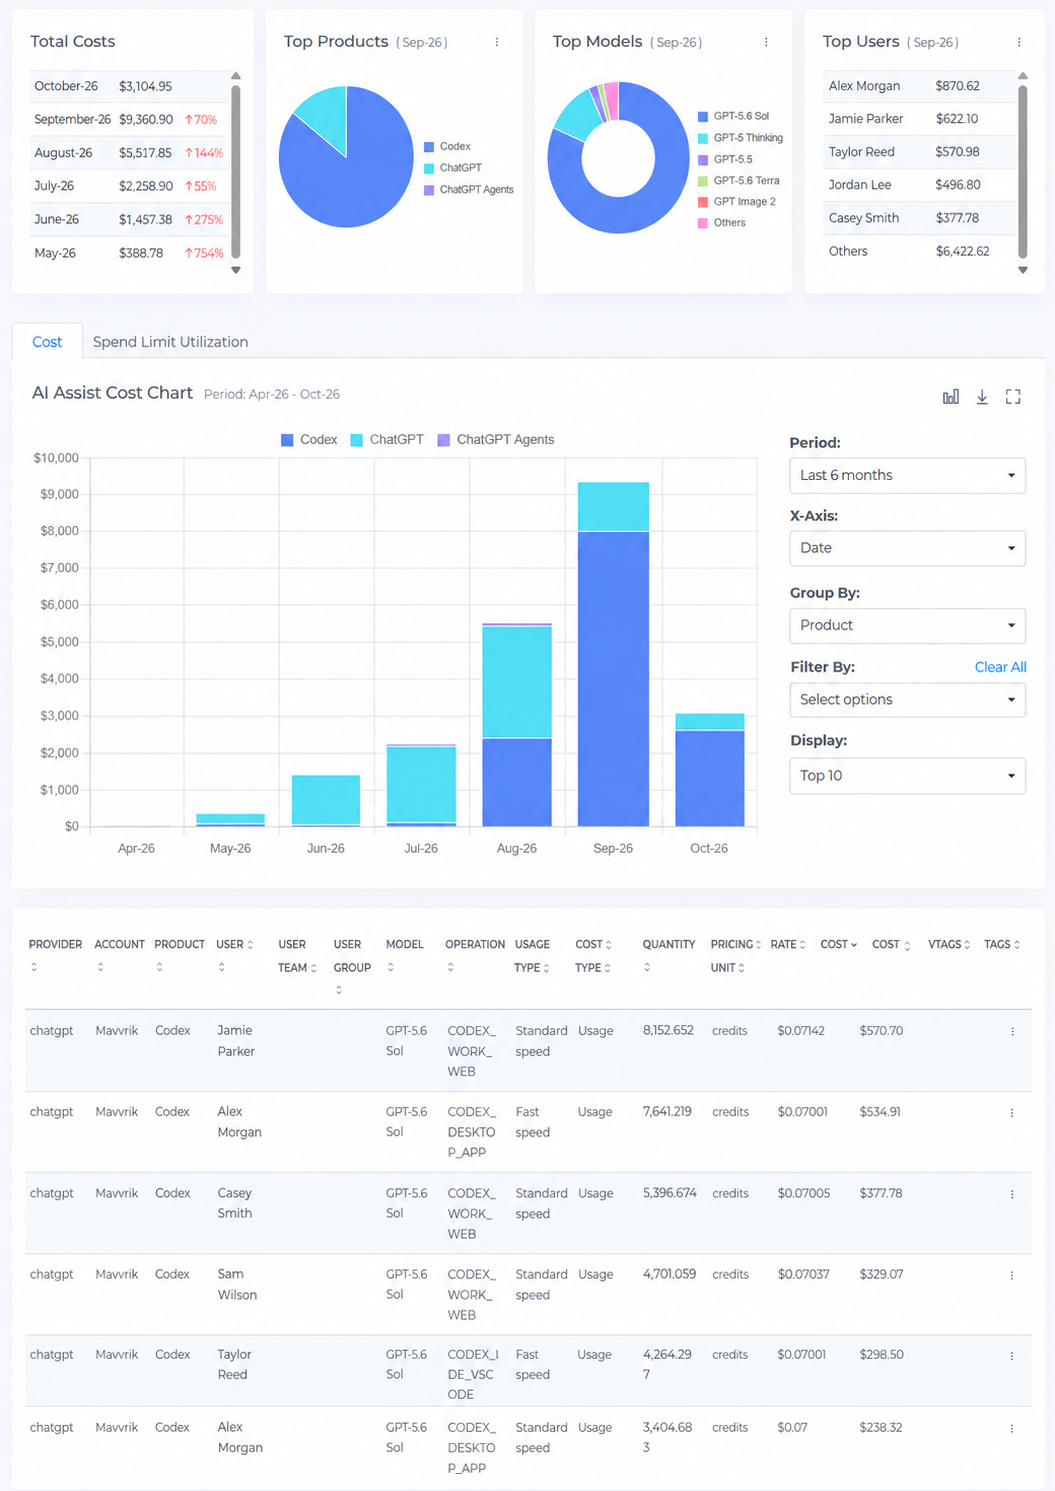
Mavvrik now supports cost and usage tracking for ChatGPT Enterprise, alongside your other AI assistant spend, such as GitHub Copilot and Claude, rather than reviewing it separately in the ChatGPT admin console. Cost and usage are broken down by user, day, and model, and your full usage history is brought in when you first connect.
Cost reflects your contract. If you enter your credit price, Mavvrik calculates cost from the credits used; otherwise it uses OpenAI’s cost estimate. Token-based contracts are reported in USD. Spend-limit utilization is included, and seat cost appears when you enter a price per seat.
New Integrations
GitHub Support for SaaS Cost
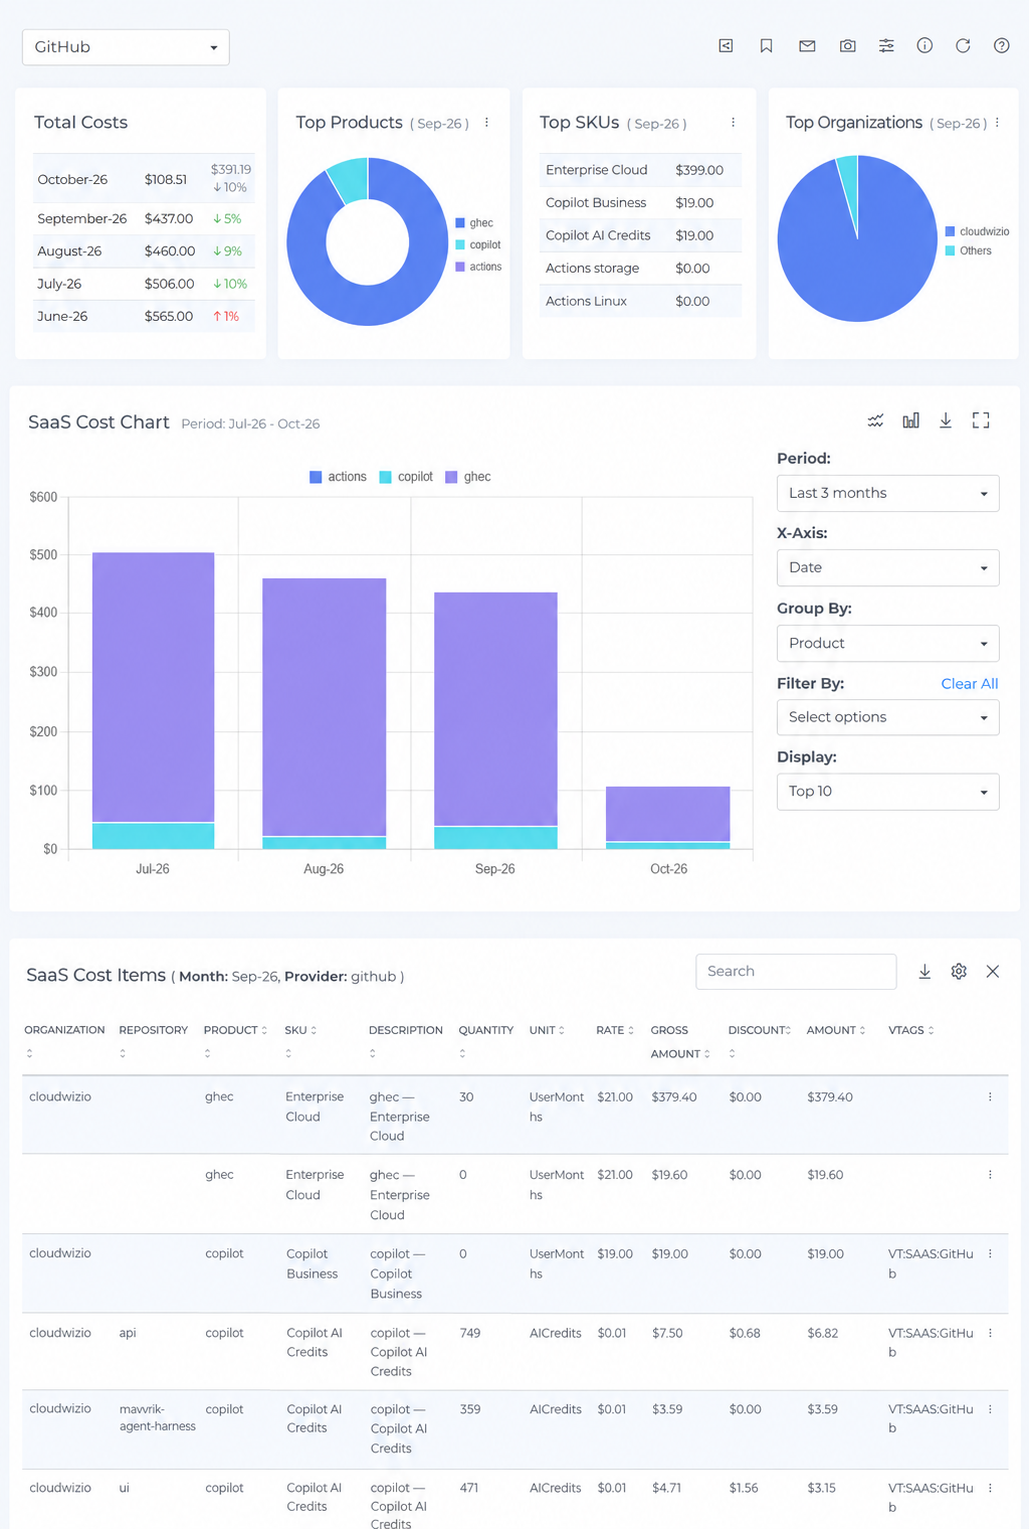
Mavvrik now supports GitHub Enterprise Cloud as a SaaS cost source, so that you can track GitHub cost and usage in the SaaS dashboard alongside the rest of your SaaS spend rather than reviewing it separately in GitHub.
Once you onboard your GitHub Enterprise Cloud account, its cost and usage appear in the SaaS dashboard.
Platform Improvements
Cost Allocation Dashboard Widgets
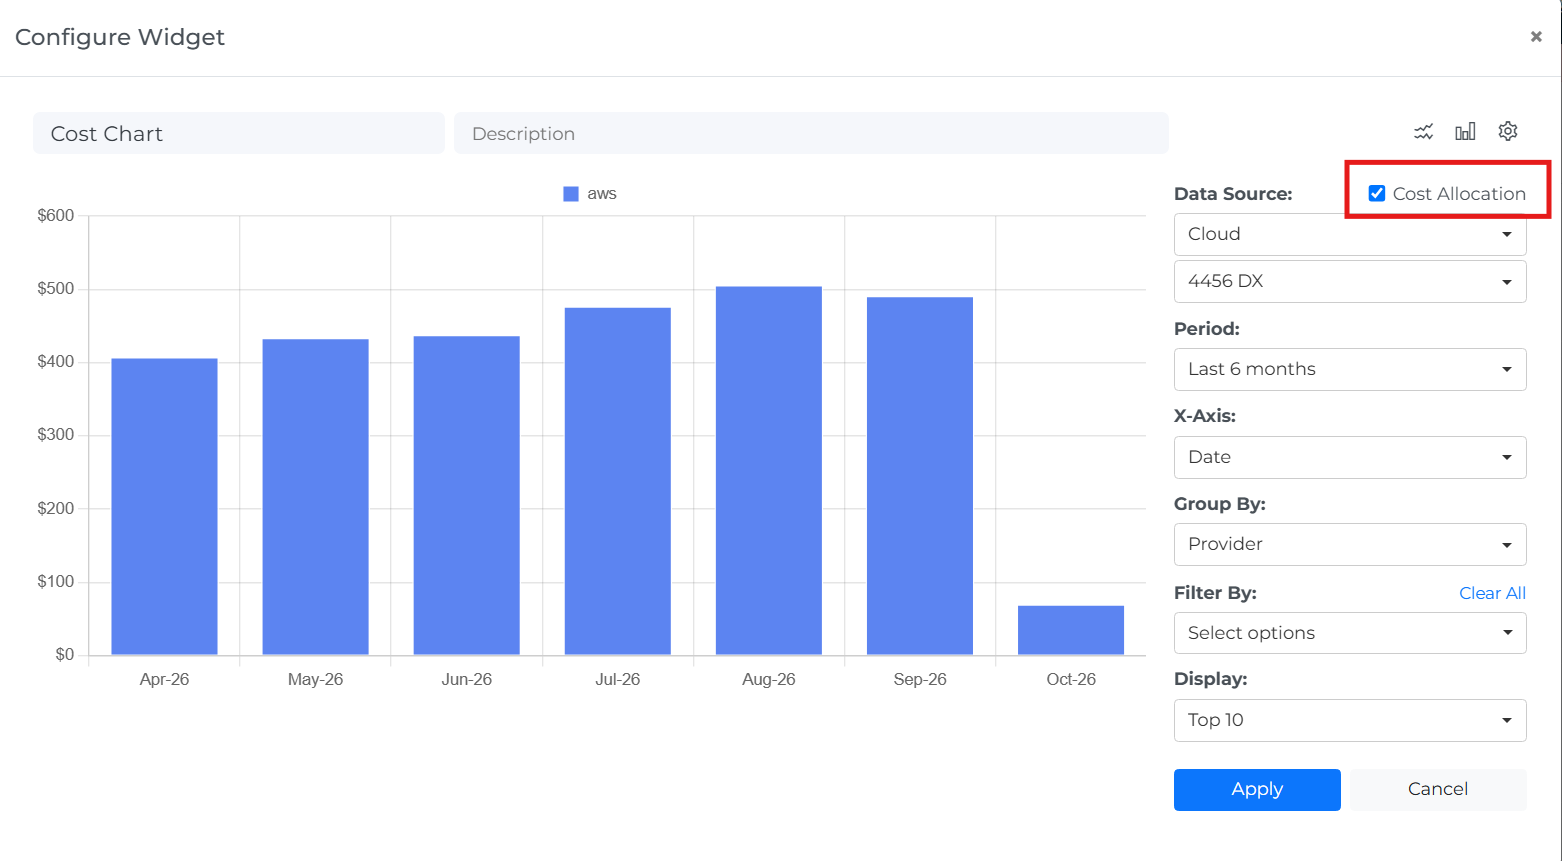
Dashboards now support widgets built from final allocated cost, including both direct and shared cost, so that executive, customer, and operational dashboards report the same allocated figures that you use in cost allocation itself. Before this release, allocated cost and dashboard reporting were separate surfaces, which meant that a stakeholder view had to be rebuilt from unallocated data and could disagree with the allocation run.
The widgets work with the existing dashboard features, including charts, tables, filters, date ranges, and saved dashboards.
Scheduled Report Delivery
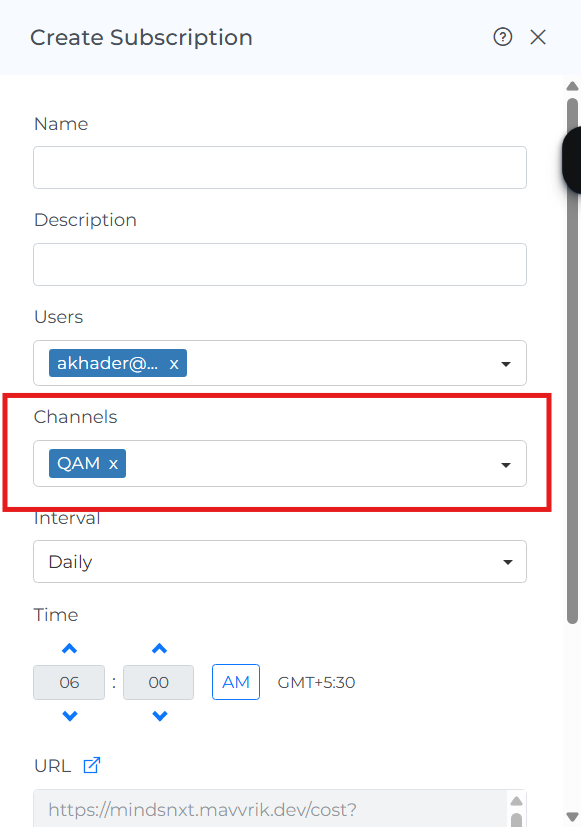
Scheduled reports and dashboard snapshots can now be delivered to external email addresses and distribution lists, so that you can send cost reports to finance partners, executives, and customers who do not hold a platform account. This removes the manual export and forward step that external reporting previously required each cycle.
External recipients receive the report output only. They do not receive access to the platform or to any data beyond the report that you send them.
Forecast Breakdown by Type
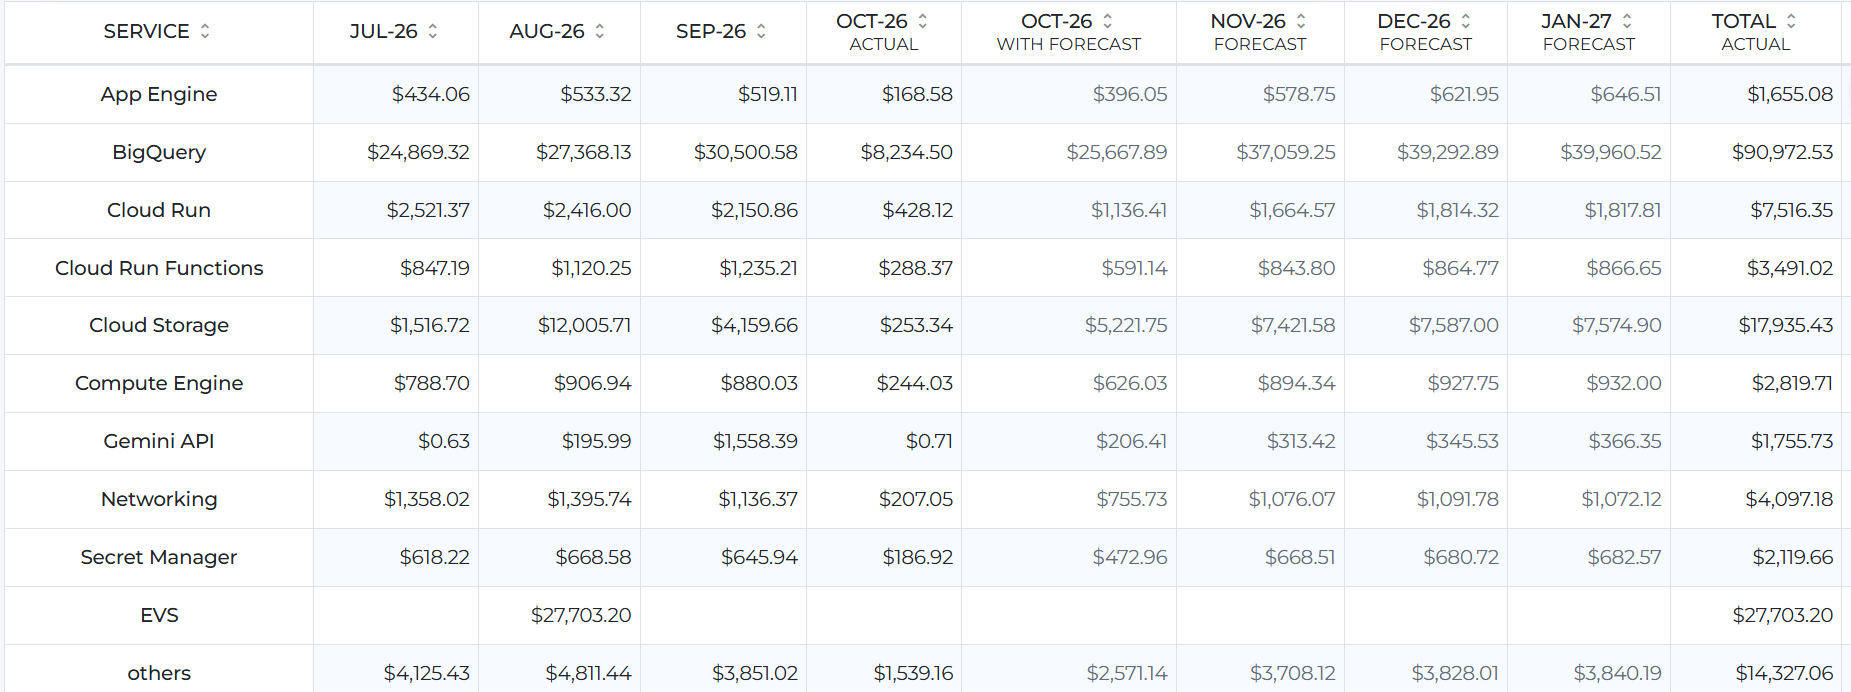
Forecasts now break down by the Group By dimension that you select, rather than returning a single total, so that you can see which providers, applications, or usage groups are driving the forecast and act on the ones that matter. A single forecast total tells you that spend is rising but not where to intervene.
For future months, you see the forecast for each grouped item. For the current month, you see actual cost alongside remaining forecast for each group. The overall forecast total is unchanged.
Cloud Sprawl Alert Thresholds
Cloud Sprawl alerts now accept percentage-increase thresholds above 100%, so that you can set a threshold that reflects normal behavior in environments where usage routinely more than doubles, such as weekday traffic following a quiet weekend. A 100% ceiling forced these environments to alert on every predictable cycle, which trains teams to ignore the alert.
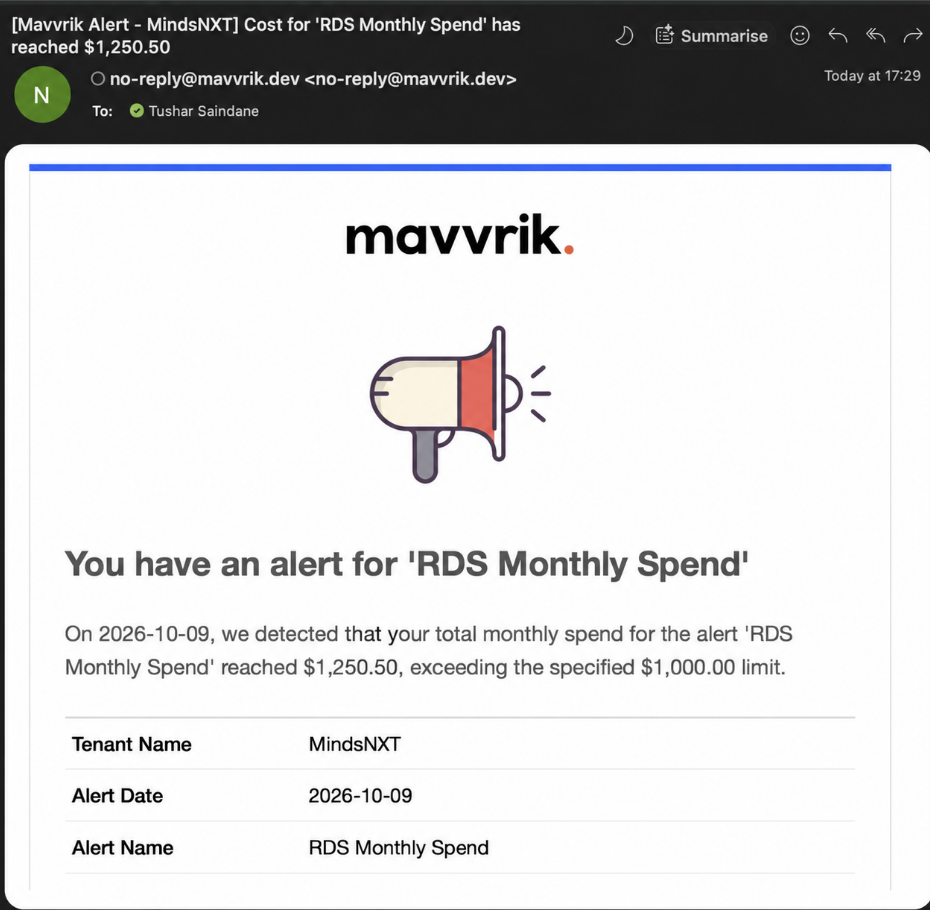
Tenant Name in Alert Emails
Alert emails now include the tenant or account name, so that partners and teams who manage several customer tenants can identify the affected customer from the email itself and triage without opening each alert in turn.
The View Details link continues to open the correct tenant and alert.
Schema Documentation in Reports
Reports now provides schema documentation in context, through an info icon beside the Schema field, so that you can confirm which field returns the value you need without leaving the report you are building. The documentation shows the schema description, the available Dimensions and Metrics, the field IDs, and the field descriptions.
|
Questions? Reach out to your Mavvrik representative. |