.png)
We’re excited to announce our September 2025 release! This update introduces the Cost to Serve dashboard for unit economics, native Datadog integration in SaaS Cost, allocation-based costing for Kubernetes, and Support for AWS Net Actual and Net Amortized Cost. Plus, a new Partner Aggregated Cost dashboard for MSPs/Resellers delivers unified customer spend and discount visibility, alongside streamlined Platform Experience enhancements.
For more details, please reach out to your Mavvrik representative or check our updated documentation https://help.mavvrik.ai/
|
Release Version |
Features |
|---|---|
|
Release-2025.09.17 |
|
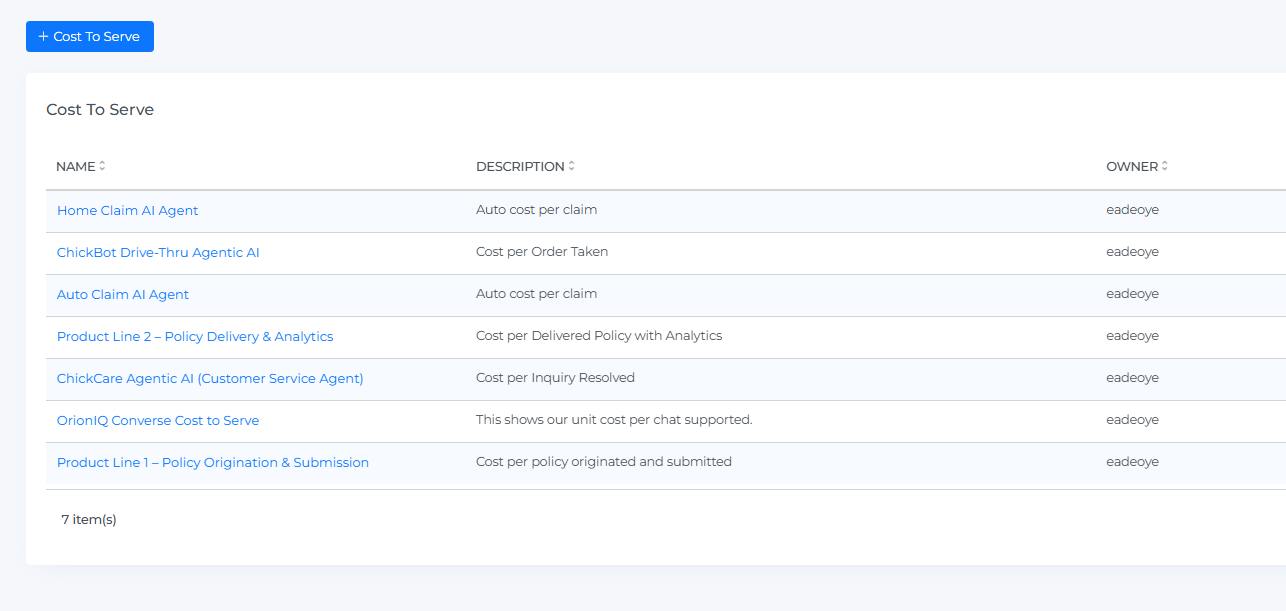
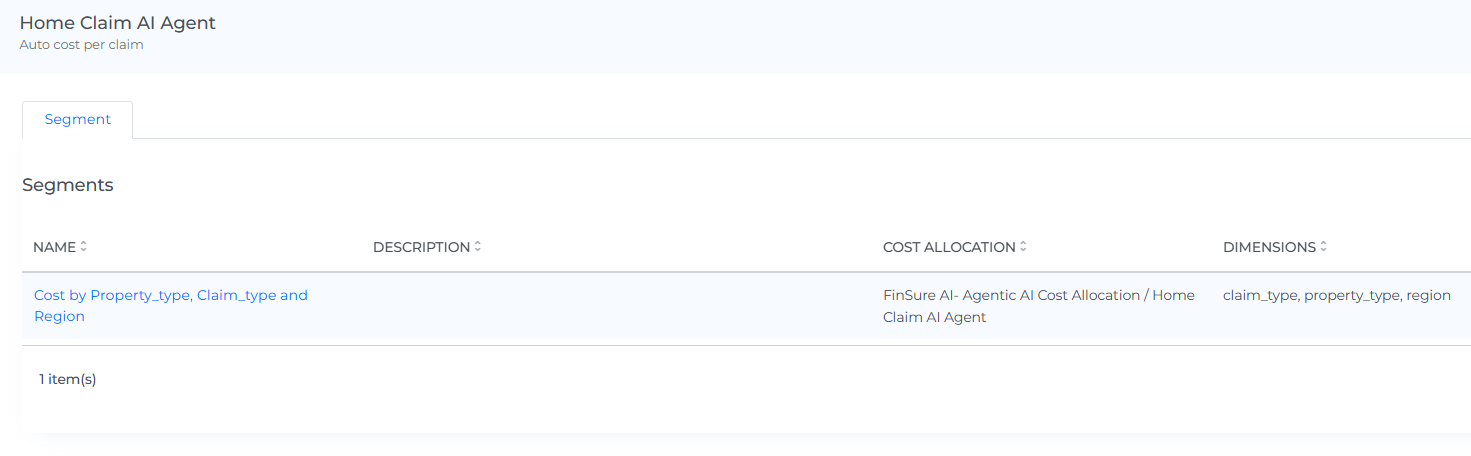
Unit Economics → Cost to Serve
Move beyond “what we spent” to “what it costs to serve.” The new Cost to Serve dashboard lets you connect total spend to business outcomes-like cost per claim, per transaction, per chat resolved, or per drive-thru order-by bringing in metrics from telemetry tools or internal databases. Use it to compare efficiency across products, regions, or segments and align Finance, Product, and Engineering on shared measures.
Why it matters
Totals don’t tell you if the business is healthy. Unit economics do. Finance, Product, and Engineering can look at the same chart and agree on whether things are getting cheaper (or more expensive) to serve.
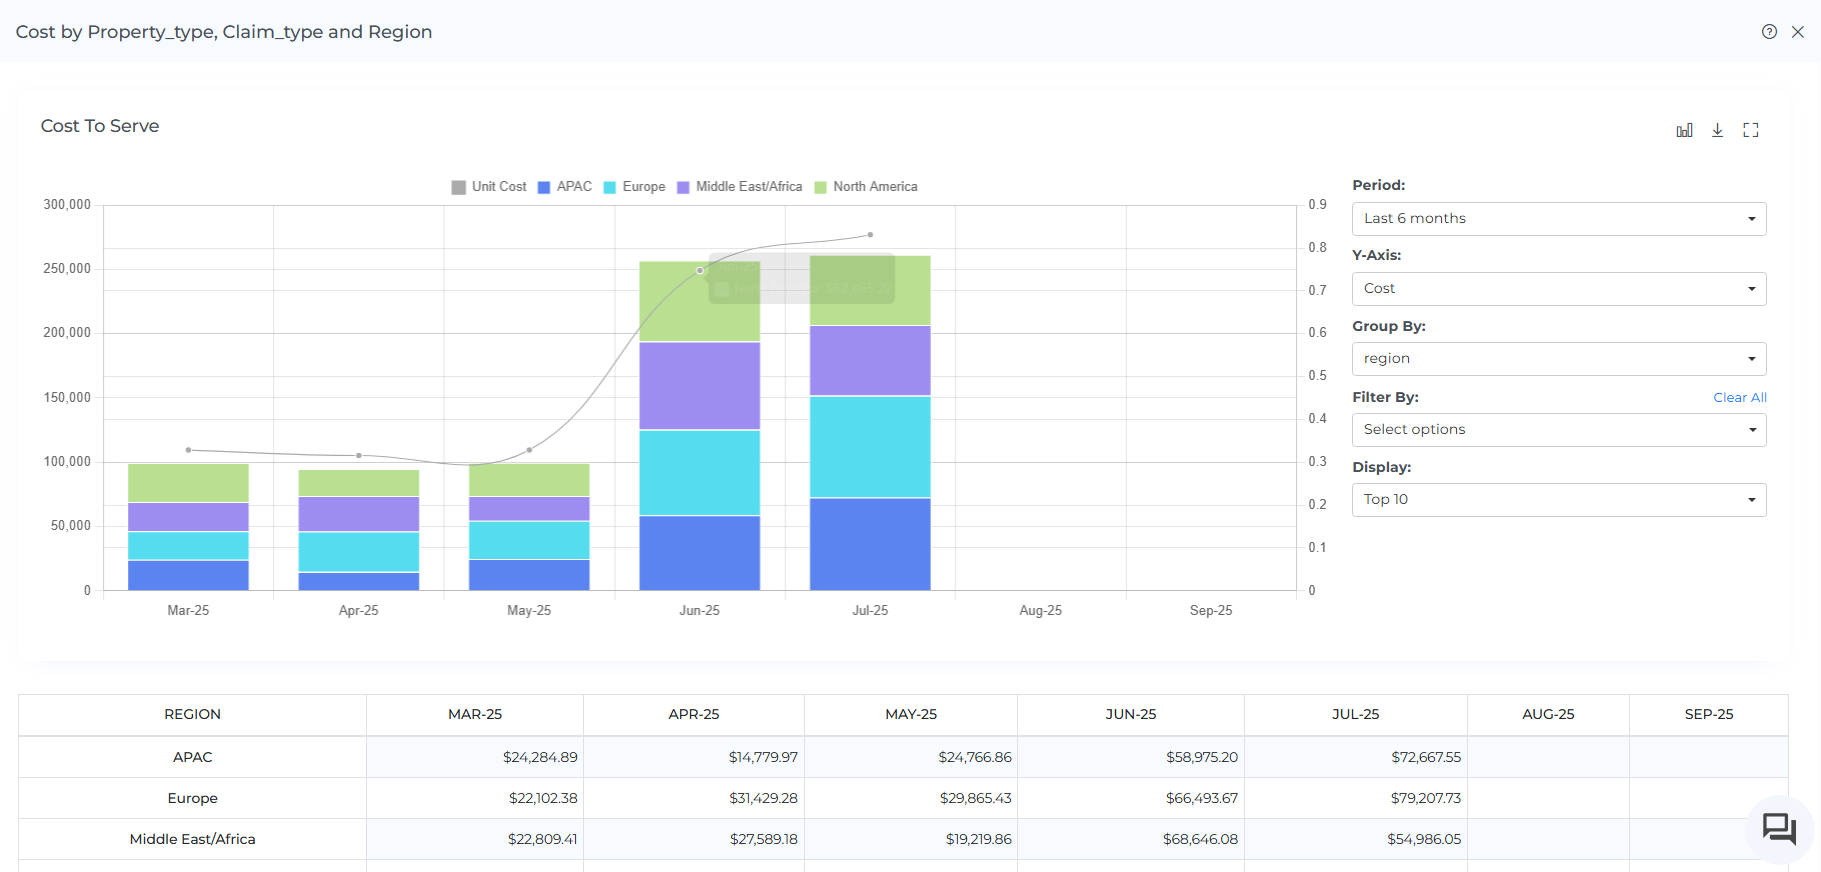
How to use it
-
Map one or more business metrics (e.g., “claims_processed”) to the relevant cost pools.
-
Compare unit cost by region, product line, or channel.
-
Set review cadence (weekly/monthly) so teams act on deltas, not anecdotes.
Note:
Unit economics work with both on-prem and cloud workloads. You can run Actuals vs Budget vs Forecast at the unit level for cleaner planning.
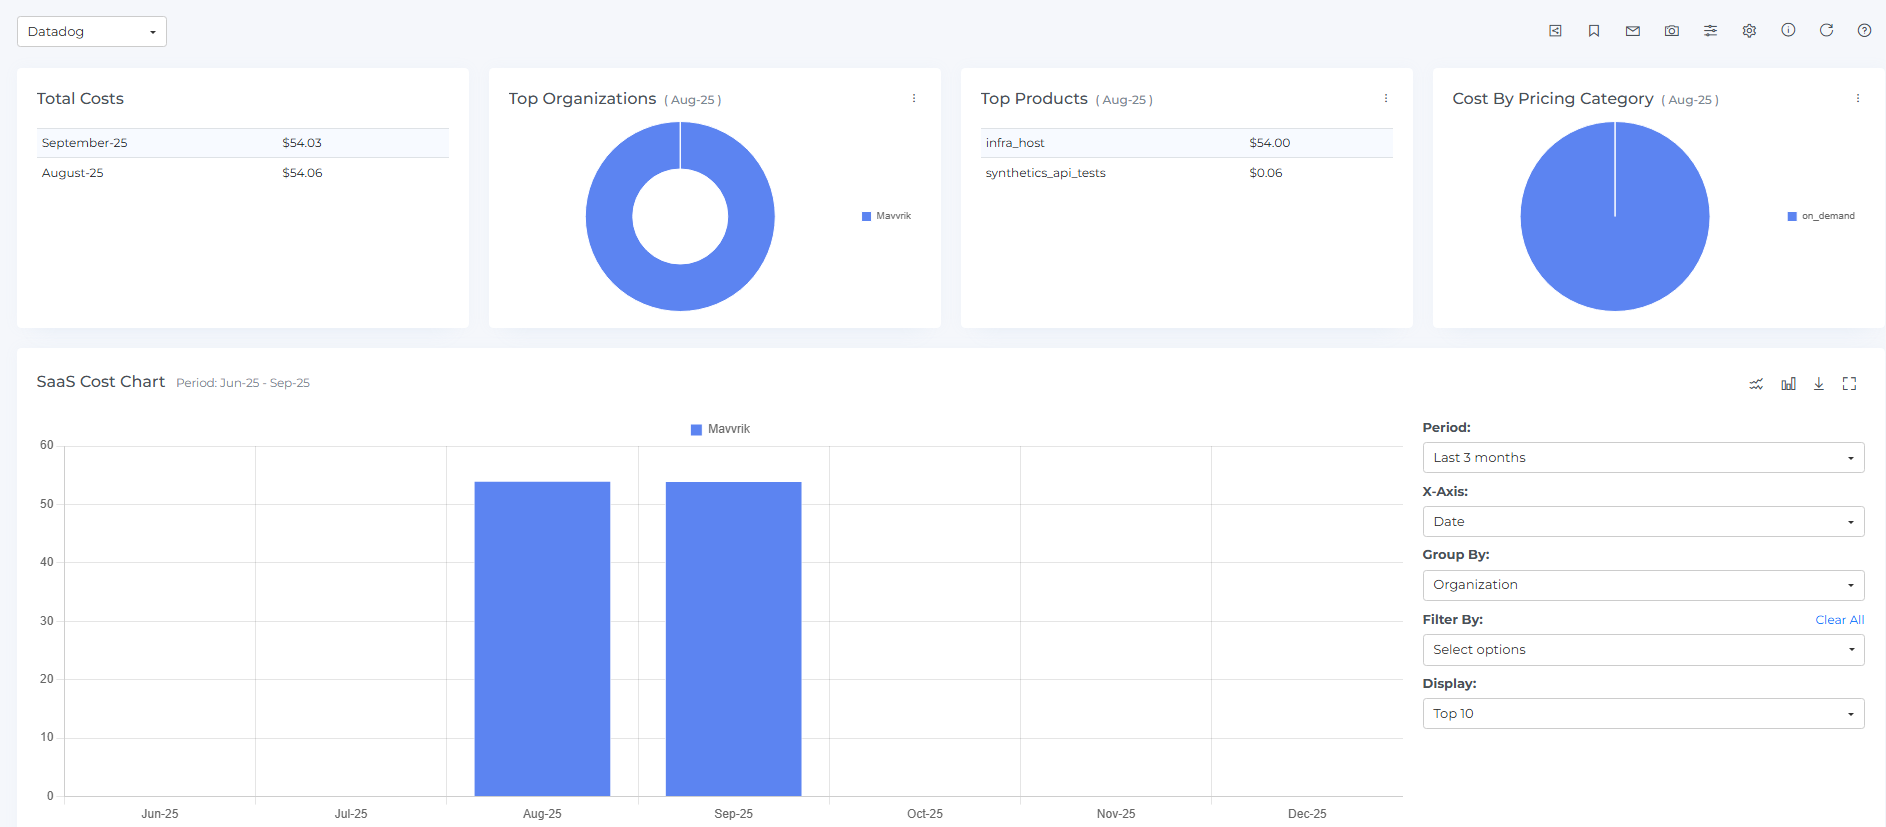
Datadog Integration – SaaS Cost Visibility
You can now bring Datadog into your SaaS Cost dashboard. Connect your Datadog account to ingest cost and usage, break down spend by Organization, Product, and Pricing Category, and view monthly totals for clean attribution and chargeback. Datadog sits alongside Snowflake, MongoDB, and other services for a unified third-party spend view. (Beta.)
Why it matters
SaaS tools hide meaningful drivers inside a single invoice. This makes Datadog spend explainable for Finance and visible to engineering managers who own the bill.
Typical questions answered
-
“Which product lines or teams are driving APM vs logs growth?”
-
“What’s the effect of our new retention policy on cost?”
Partner Aggregated Cost Dashboard (MSP/Reseller)
Partners can now see cross-customer spend and margin in one place. See aggregated cost across tenants, drill down by customer, provider, or service to spot trends and outliers, and view list price, applied discounts, and net payable to understand margin at a glance.
Account teams can spot outliers and margin erosion early. Finance can reconcile partner-level statements without manual exports. Supports both pass-through and bundled commercial models.
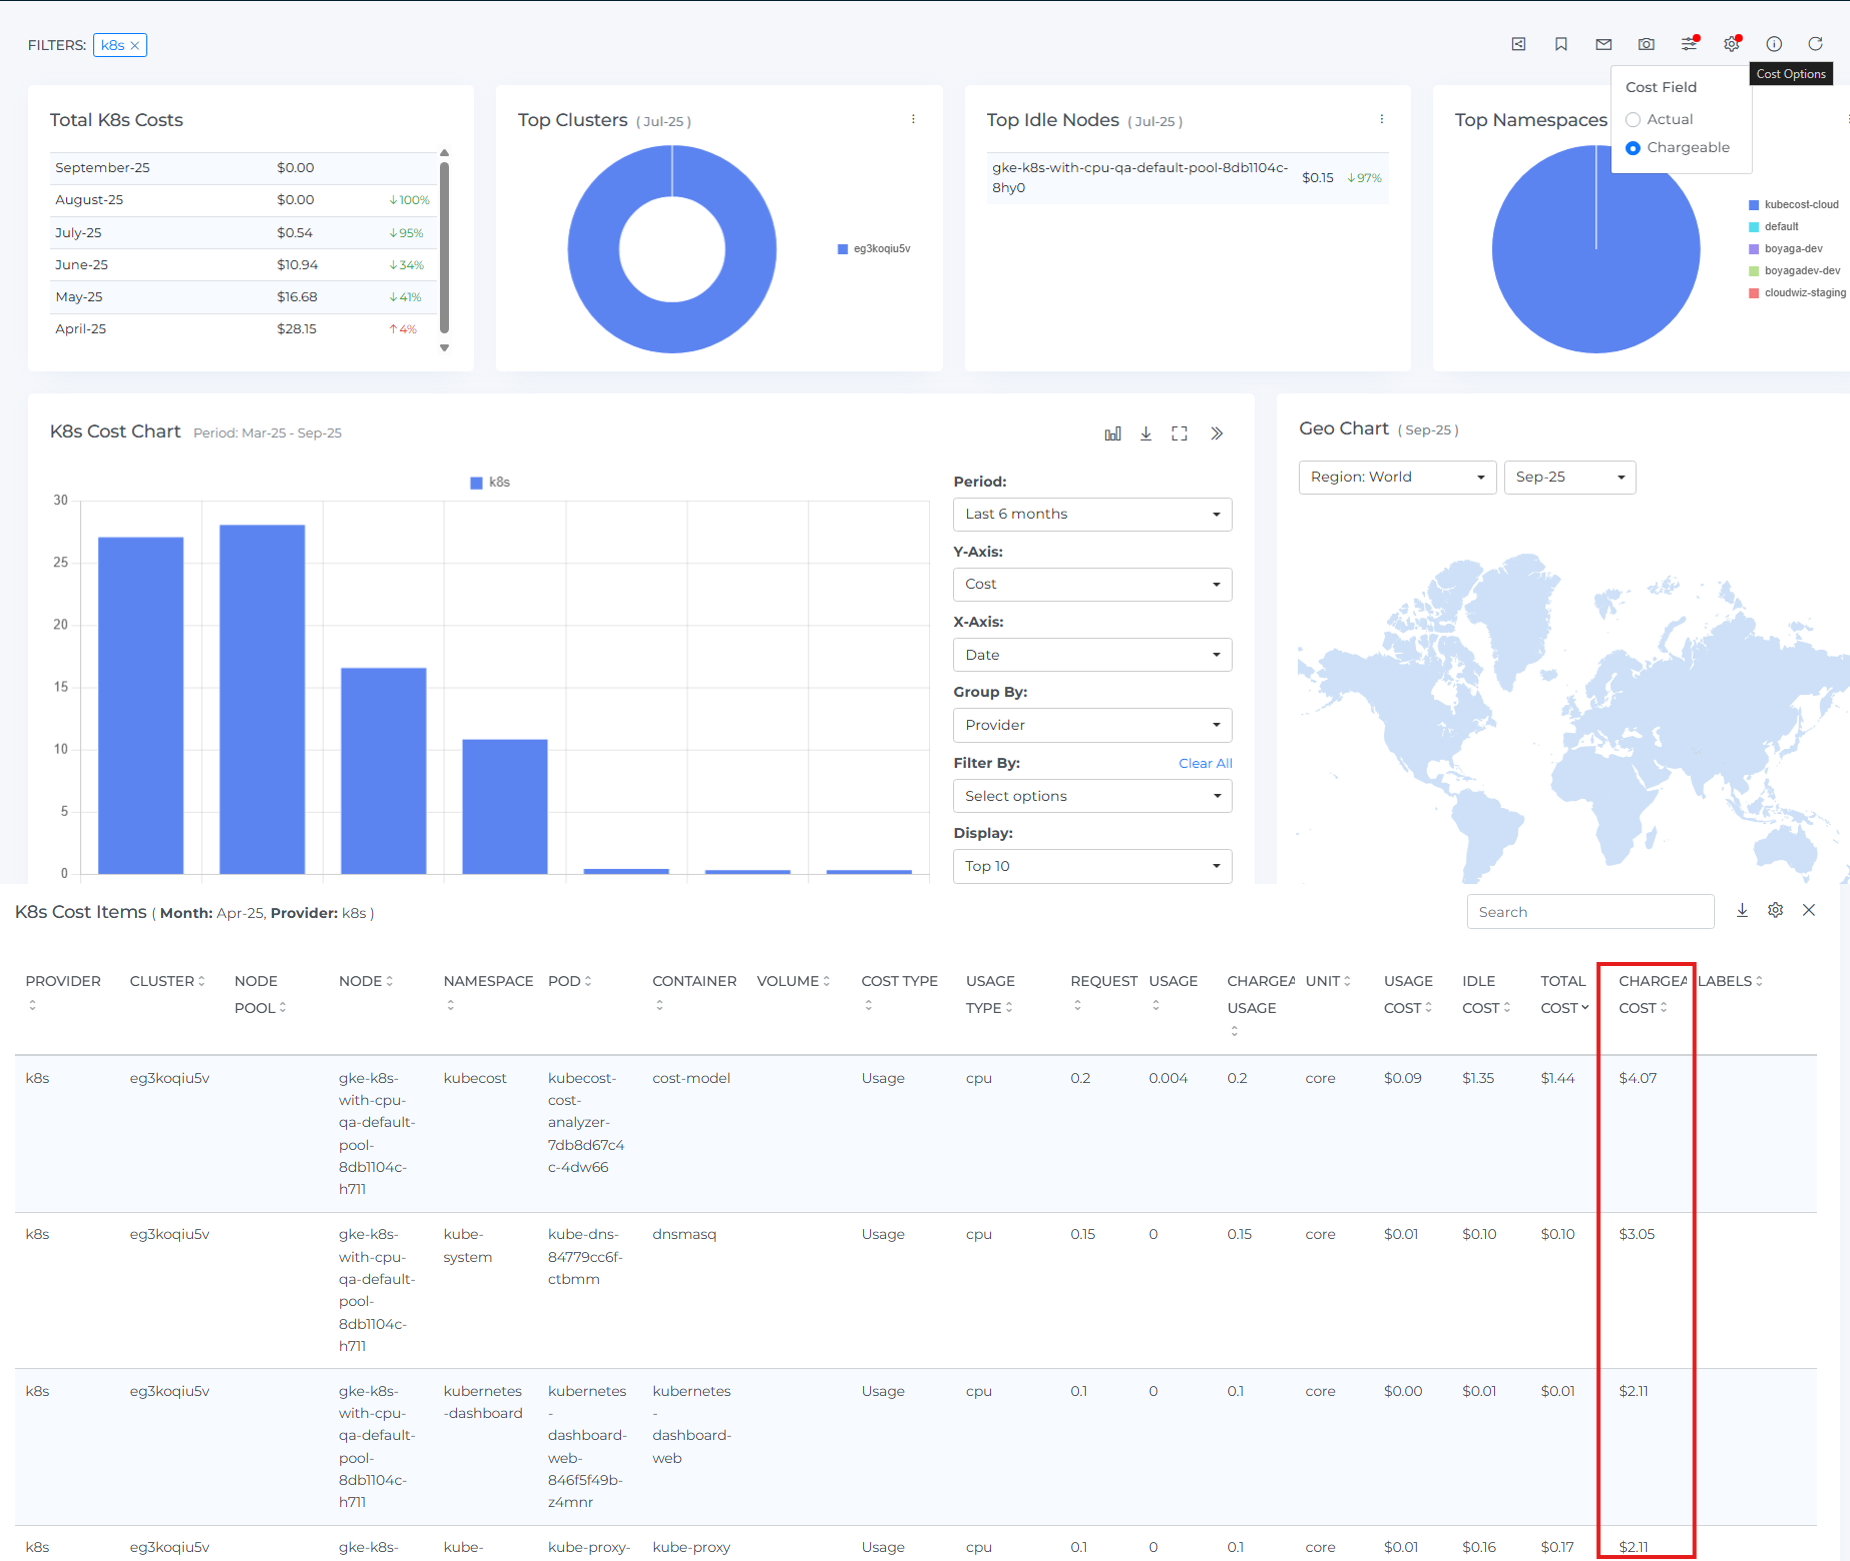
Kubernetes Allocation-Based Costing
Kubernetes cost visibility now supports allocation-based costing (alongside usage-based). Calculate costs from CPU requests, memory limits, GPU provisions, and persistent volumes-useful for predictable budgeting, showback, or chargeback. Toggle Chargeable Cost to see what you’ll bill downstream, and choose the model (usage vs. allocation) that fits your financial policies and reporting needs. Available in the K8s Cost dashboard.
Why it matters
Some orgs prefer predictable, policy-driven allocation (requests/limits) over noisy usage. Others want true usage for optimization. Now you can use either-or both-for different audiences.
Support for AWS Net Actual and Net Amortized
Two new AWS cost views help you report with confidence:
-
Net Actual shows what you actually pay-usage with discounts applied and allocated across usage.
-
Net Amortized spreads RI/Savings Plan commitments evenly over their term for steadier, apples-to-apples reporting.
Why it matters
Different audiences need different truths. Actuals for cash; amortized for apples-to-apples trend analysis. Reporting stops arguing, planning gets cleaner.
Enablement is available via your Customer Success Manager.
Platform Experience Enhancements
We’ve rolled out upgrades that streamline navigation, enrich dashboards, and strengthen cost governance—all in one place:
-
Custom Dashboards: Jump from a filtered widget straight into the full dashboard for deeper exploration, and enrich widgets with SaaS metrics so third-party spend sits alongside your core KPIs.
-
SaaS Overview Dashboard Forecast: View forecasted SaaS costs in the Overview Dashboard for better planning and trend analysis.
-
Azure RI Dashboard – RI Name: Quickly identify and report on specific Azure reservations with the new RI Name field.
-
Public Clouds – Disable Usage Accounts: Disable unused usage accounts to stop data ingestion/processing, reduce noise, and keep reports focused (re-enable anytime).
-
Snowflake: Expanded visibility with Warehouse Cost Support to analyze spend at the warehouse level, plus an Include/Exclude Discounts toggle to switch between list-price and net views—making attribution, chargeback, and optimization clearer.
-
Cost Allocation: Improved with visibility of expired allocations for complete history and auditing, a new Active/End of Life lifecycle field to annotate segments/units, and clearer breadcrumb titles for faster navigation—streamlining governance, reporting, and collaboration.