.png)
We’re excited to announce our December 2025 release! In this release, we’re introducing a new way to create custom reports, along with several updates that make cost reviews, governance, and savings analysis more reliable. You’ll see a Custom Report Builder (Beta), small navigation and charting changes to reduce accidental updates, tighter budget and allocation views in Custom Dashboards, and more accurate GPU chargeback and savings signals across Kubernetes and GCP.
For more details, please reach out to your Mavvrik representative or check our updated documentation Help Center
|
Release Version |
Features |
|---|---|
|
Release-2025.12.19 |
|
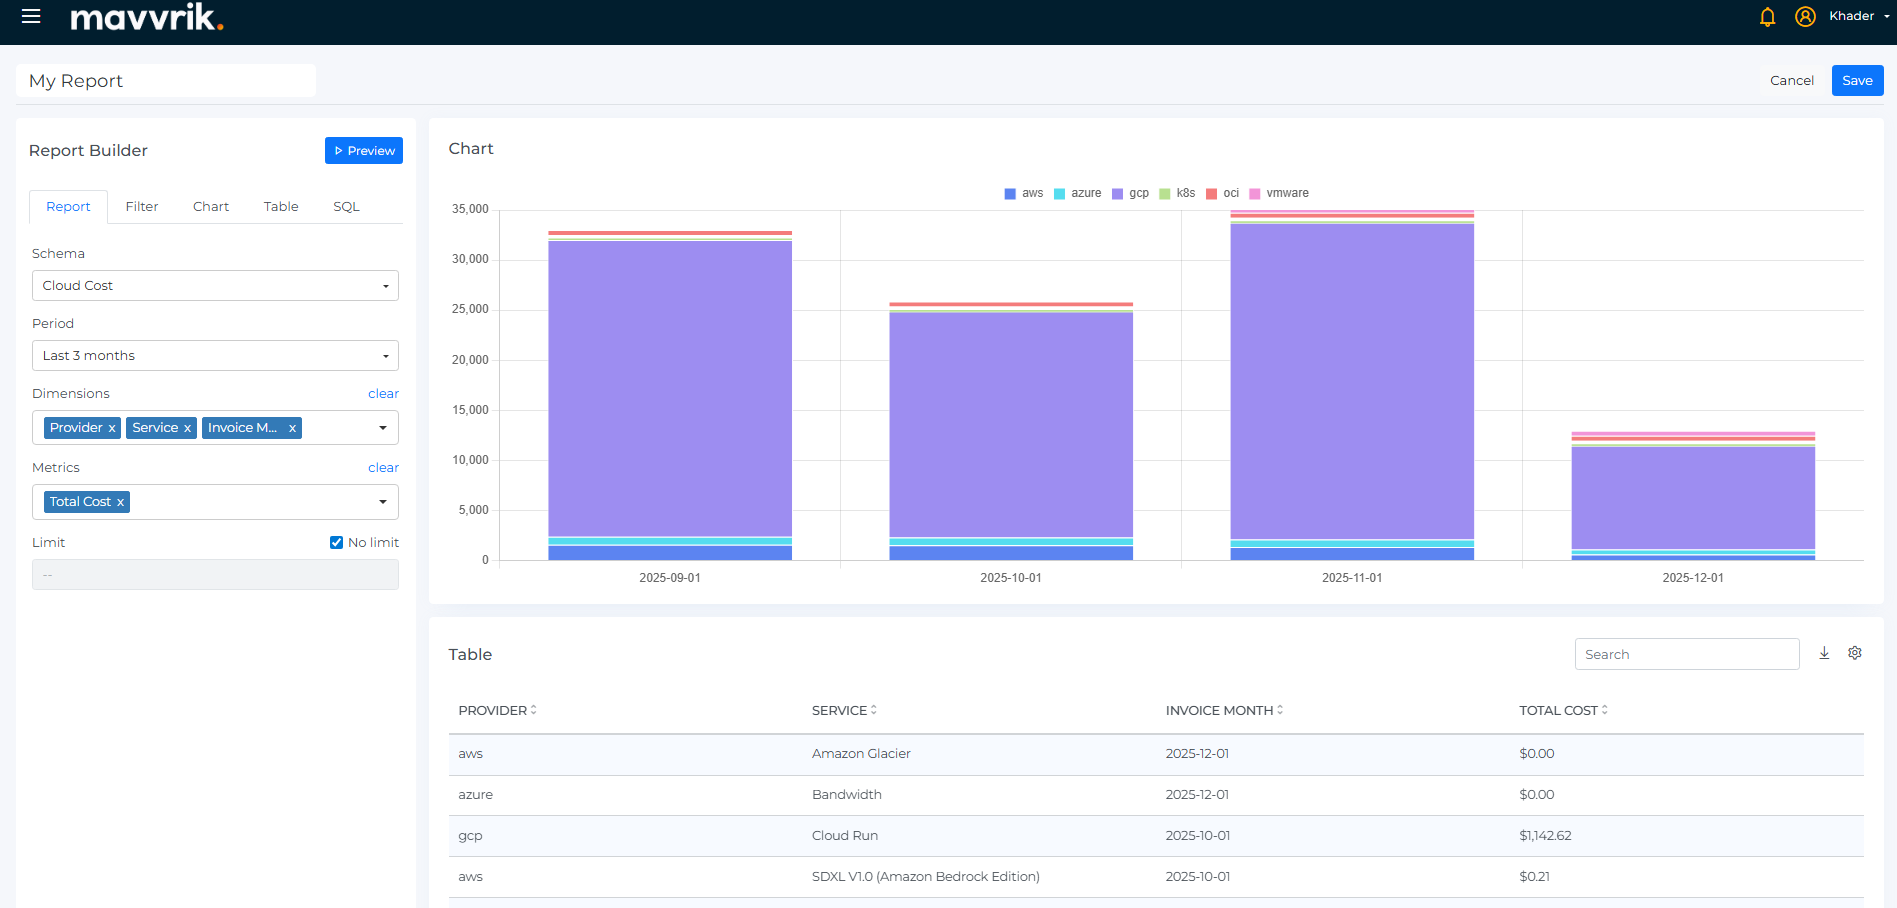
Custom Report Builder
We’re introducing a Custom Report Builder that lets teams create tailored views without writing SQL. You select the dimensions, metrics, and filters you care about, and Mavvrik generates the query and renders a chart with the supporting table beneath it. This makes it easier to explore trends and validate numbers in the same view.
Reports can switch between Cloud Cost, Cloud Resources, Datacenter Cost, Kubernetes Cost, and GenAI Cost schemas, so the same analysis can be reused across environments. Time ranges support last 1, 3, 6, or 12 months, as well as custom periods, to match different review cycles.
Typical questions answered:
“Can we combine custom dimensions and metrics without SQL?”
“Can we see the visual trend and the underlying rows together?”
“Can the same report work across cloud, datacenter, K8s, and GenAI?”
“Can we control the time period used in the report?”
Note: This feature is in Beta. Contact your Customer Success Manager to request access.
Navigation & Charts : UX Updates
-
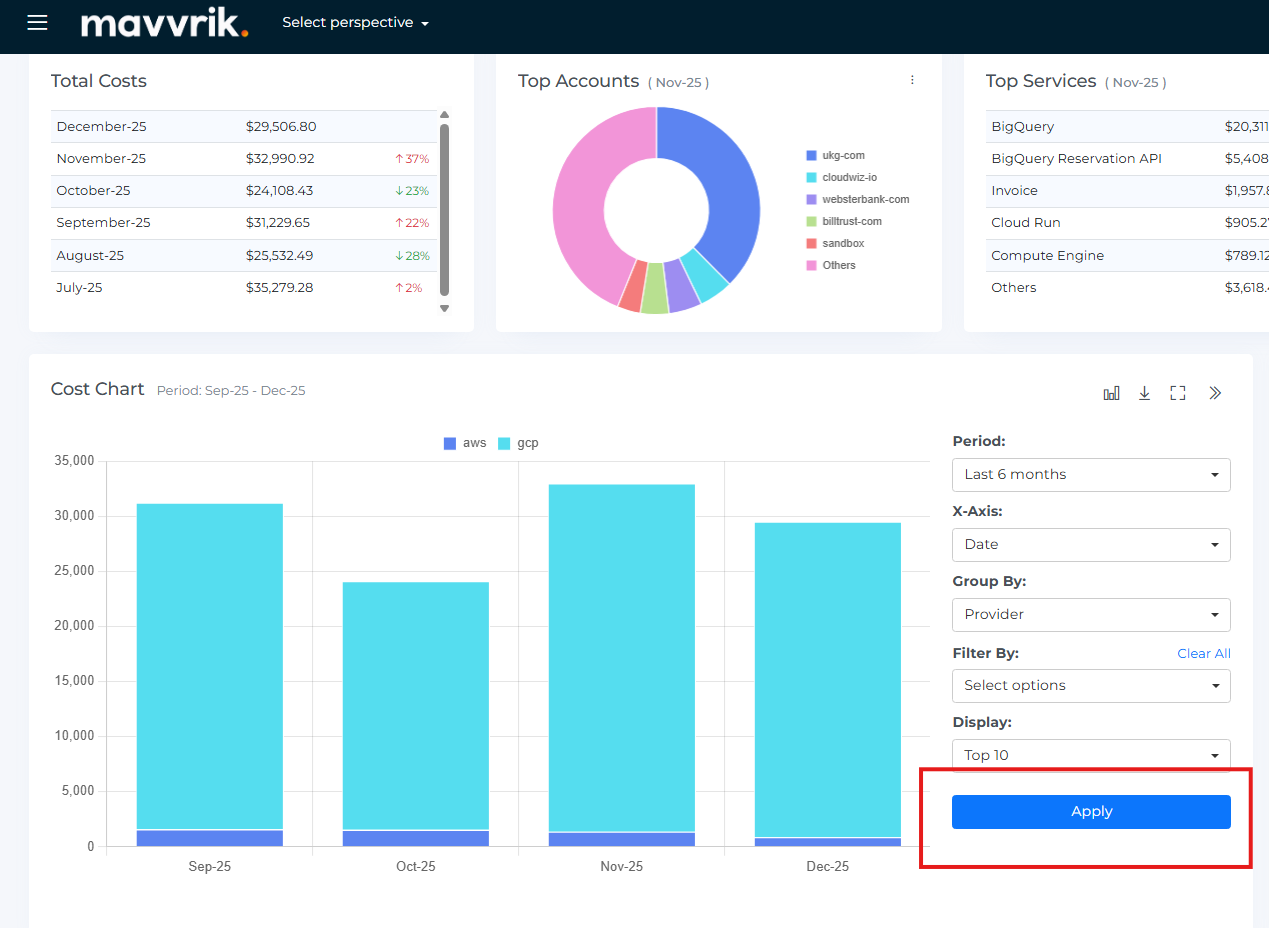
Chart Configurator : Apply to Update
We’re changing how chart updates are applied. For widgets and Geo charts, changes now take effect only after clicking Apply. This avoids charts refreshing mid-edit and reduces confusion while multiple settings are being adjusted.
Navigation : Favorites to the Top
We’ve moved My Favorites to the top of the left sidebar and unified bookmarks, dashboards, and reports into one place. Tenant-level dashboards and reports shared with everyone are pinned here by default and remain visible to all users.
-
Navigation : Overview under “Inform”
Overview under the Inform section is the first item now, keeping high-level views grouped together.
-
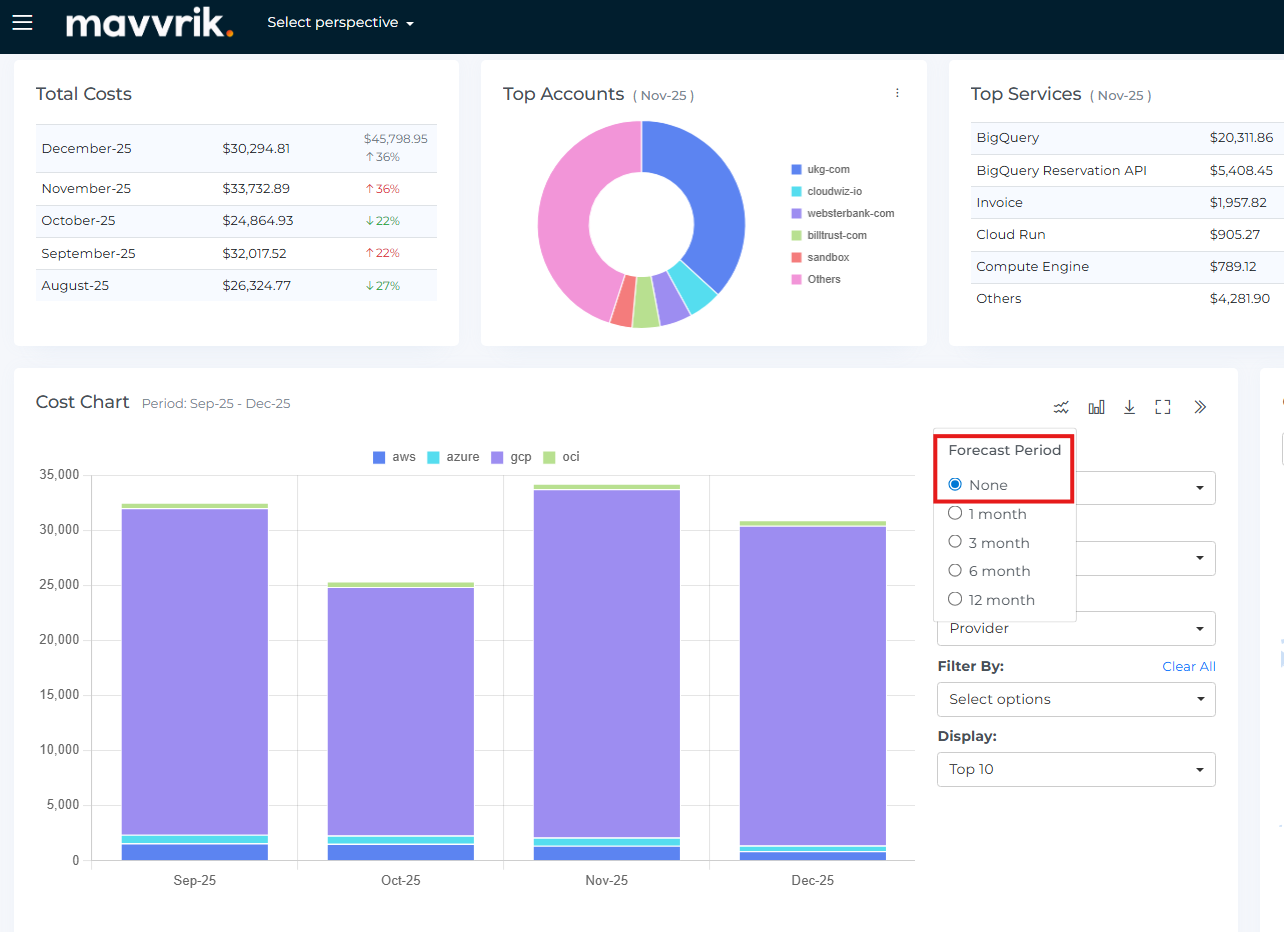
Forecast Default : None
Forecast is now turned off by default. Dashboards load with actuals unless forecast is explicitly enabled.
Custom Dashboard Enhancements
-
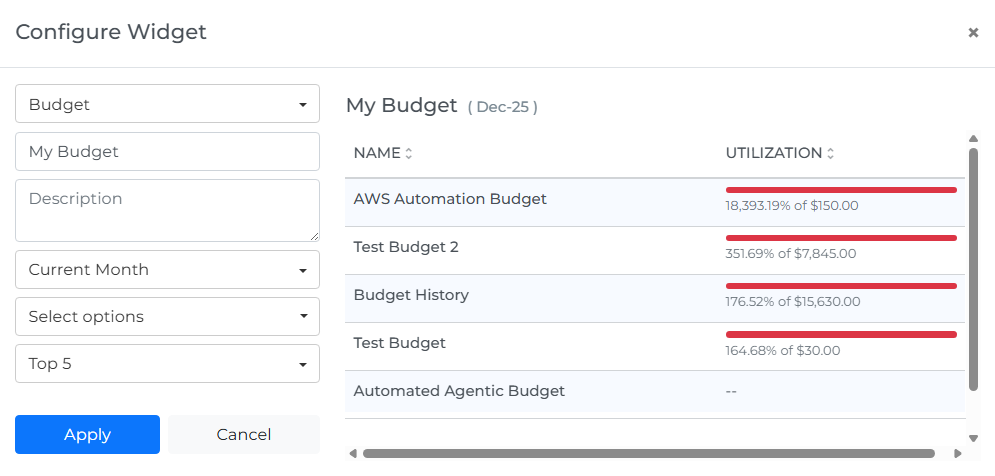
Budget and Cost Allocation is now grouped together in Custom Dashboards so governance-related views live in one place.
-
The Budget widget shows budget versus actuals directly on the dashboard, making it easier to check status during reviews without exporting data.
-
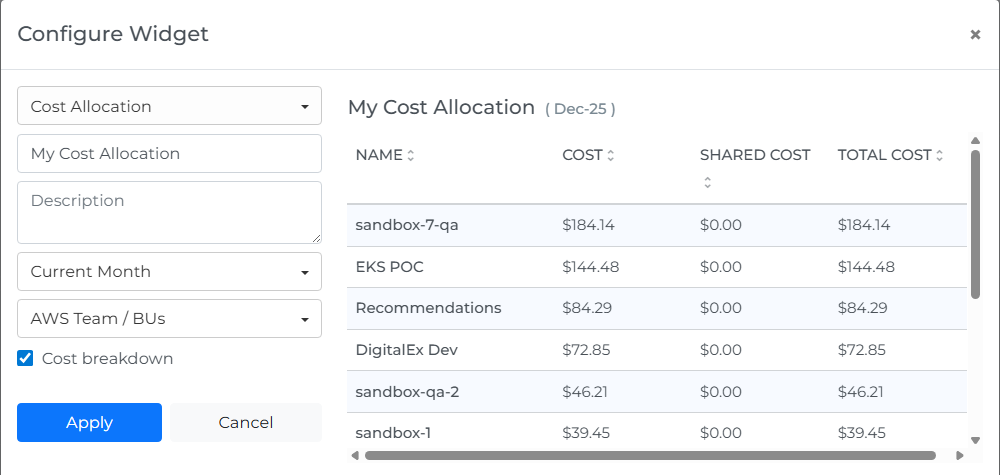
The Cost Allocation table view adds a month-specific, tabular breakdown with Cost, Shared Cost, Total Cost, Budget, and Utilization columns. This supports clearer chargeback and easier review.
-
For Data Chart widgets, chart type and forecast inclusion can be selected during creation, reducing follow-up edits.
Platform Improvements:
-
Kubernetes (Self-Hosted on AWS) : GPU Chargeback
We’ve added GPU chargeback support for self-hosted Kubernetes clusters on AWS. GPU costs are now attributed directly, rather than being absorbed into CPU or memory costs.
-
Kubernetes (EKS) : GPU Chargeback & Flexible Splits
Discover GPUs attached to EKS clusters and support splitting costs across CPU, memory, and GPU. This improves allocation accuracy for mixed workloads.
-
Savings Recommendations(GCP) : CUDs -Aware Insights
Savings recommendations now indicate when a resource already has active CUD coverage. This helps teams focus on actions that can lead to additional savings and avoid false positives.