.png)
We’re excited to announce our January 2026 release! This update introduces the Generic CSV Connector for easy cost ingest from unsupported vendors, Kubernetes EKS/GKE via provider cost reports (no appliance) for faster cluster visibility, Savings: Advanced Settings to target different policy sets by account/team/environment, and Dashboards & Reports upgrades including a Cost to Serve widget plus table search & CSV download in Report Builder.
For more details, please reach out to your Mavvrik representative or check our updated documentation Help Center
|
Release Version |
Features |
|---|---|
|
Release-2026.01.15 |
|
Bring Your Own Cost Schema BETA
Fill the gaps in your cost visibility
Not all vendors are supported yet, and some costs live in internal systems. Now you can bring that data into Mavvrik alongside your existing SaaS spend.
Simply upload a CSV, map the fields once, and those costs will appear in your dashboards, allocations, and reports—just like any other spend in Mavvrik.
Note: This feature is in Beta. Contact your Customer Success Manager to request access.
Kubernetes : EKS/GKE via Provider Cost Reports
Get cluster visibility without the operational overhead
You can now onboard Amazon EKS and Google GKE clusters without installing an appliance. Mavvrik uses your native AWS and GCP cost reports to allocate Kubernetes spend automatically.
You'll still get the granular breakdowns you need—by namespace, pod, and workload—for accurate chargeback and showback, but with faster setup and less infrastructure to manage.
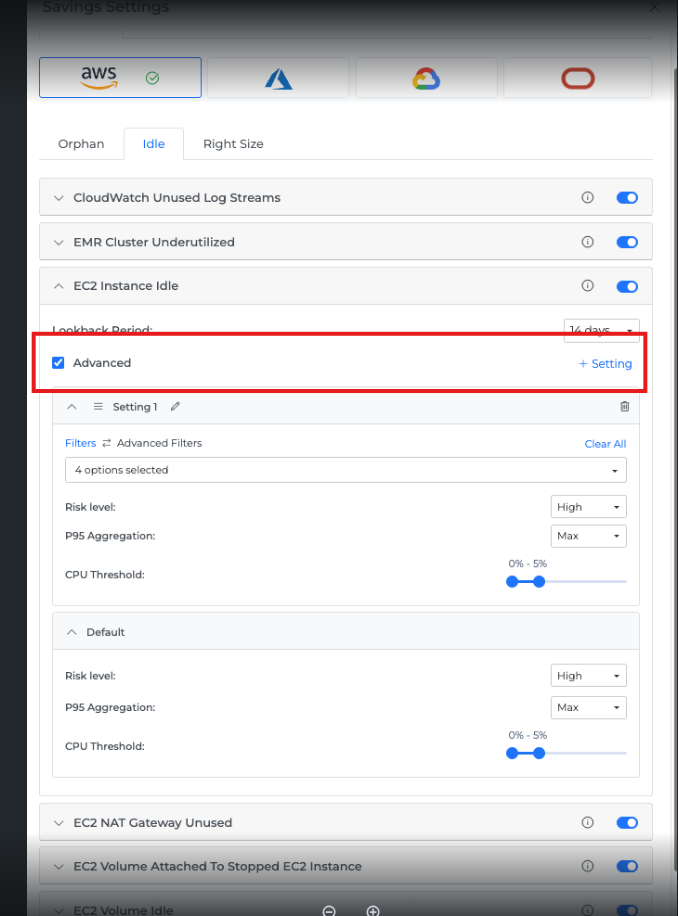
Savings: Advanced Settings
Tailor savings strategies to different parts of your organization
Create multiple savings policy sets and apply them to specific targets like cloud accounts, business units, user groups, or environments.
Each policy set can have its own thresholds, aggregation rules, and risk settings, giving you precise control over how savings recommendations are generated across your organization. You can easily see which targets are using which policy set for complete transparency.
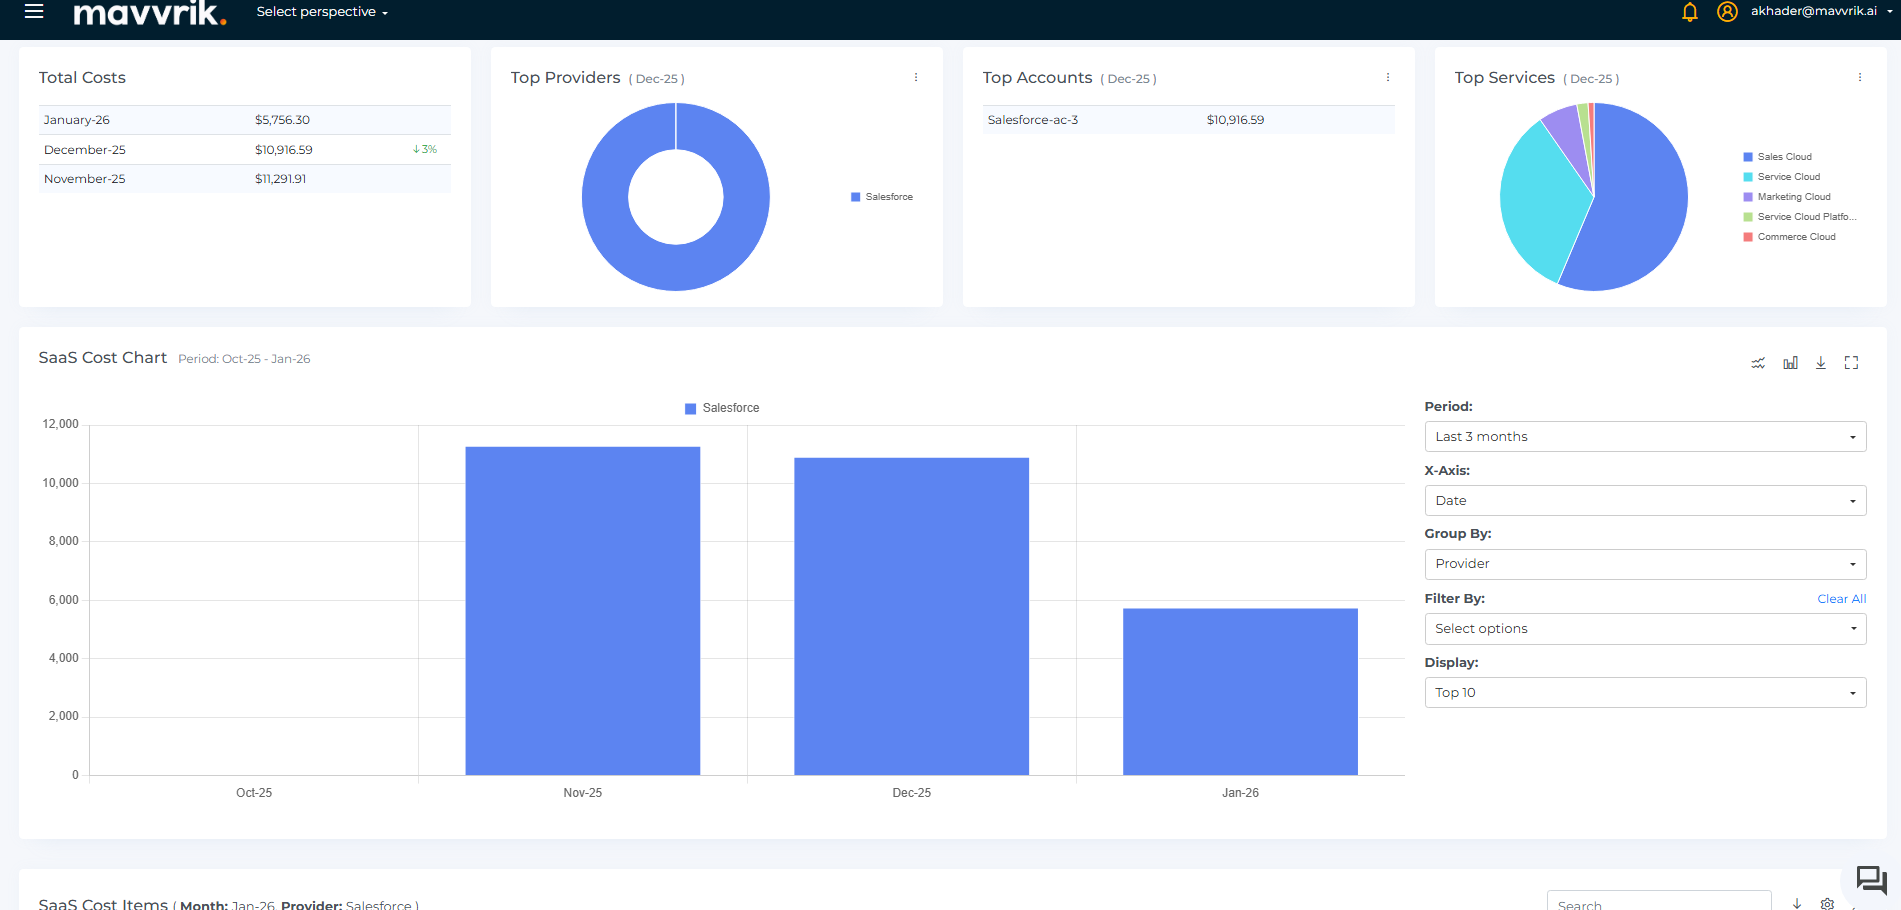
Custom Dashboard & Report Builder Enhancements
-
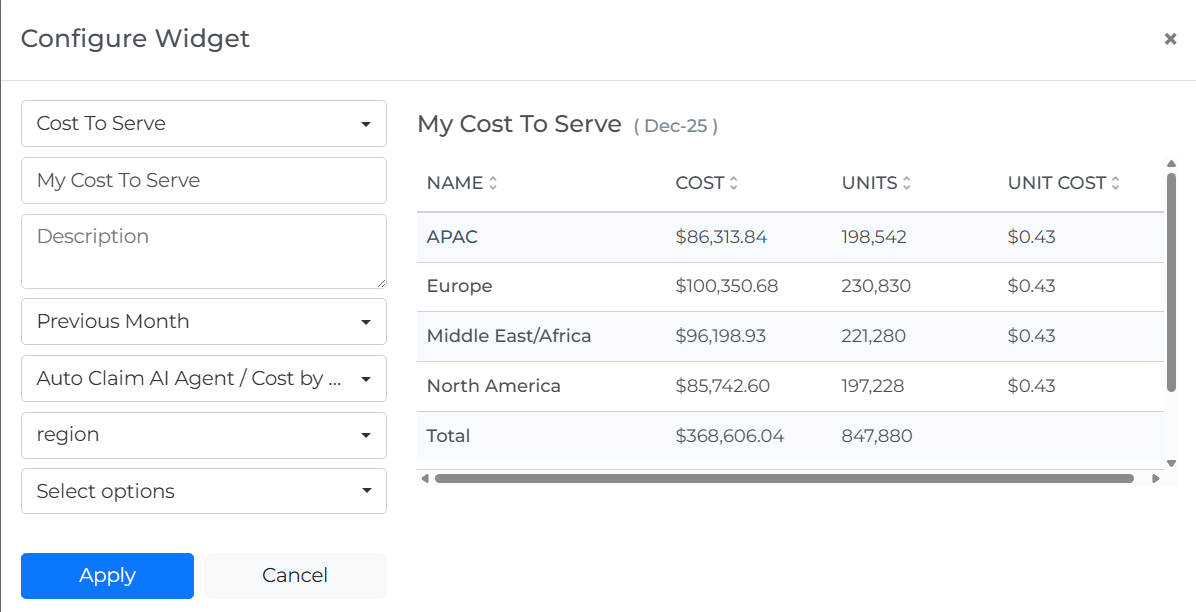
Cost to Serve (Custom Dashboard)
Add a Cost to Serve widget to your Custom Dashboards alongside Budget and Cost Allocation widgets. This makes it easier to review unit economics and cost governance in one centralized view.
-
Report Builder (table tools)
Report Builder tables now support search, so you can quickly find specific rows while reviewing results. You can also download the table as a CSV for sharing or offline analysis. Search and download work independently.