.png)
We're excited to announce our May 2025 release! This update introduces major branding changes across our platform and brings SaaS cost visibility through Databricks integration. We've also expanded AI cost governance with support for AI Foundry and delivered key enhancements to anomaly detection, cost variance analysis, and cost attribution workflows. For more details, reach out to your Mavvrik representative or check our updated documentation: https://help.mavvrik.ai.
|
Release Version |
Features |
|---|---|
|
Release-2025.05.14 |
|
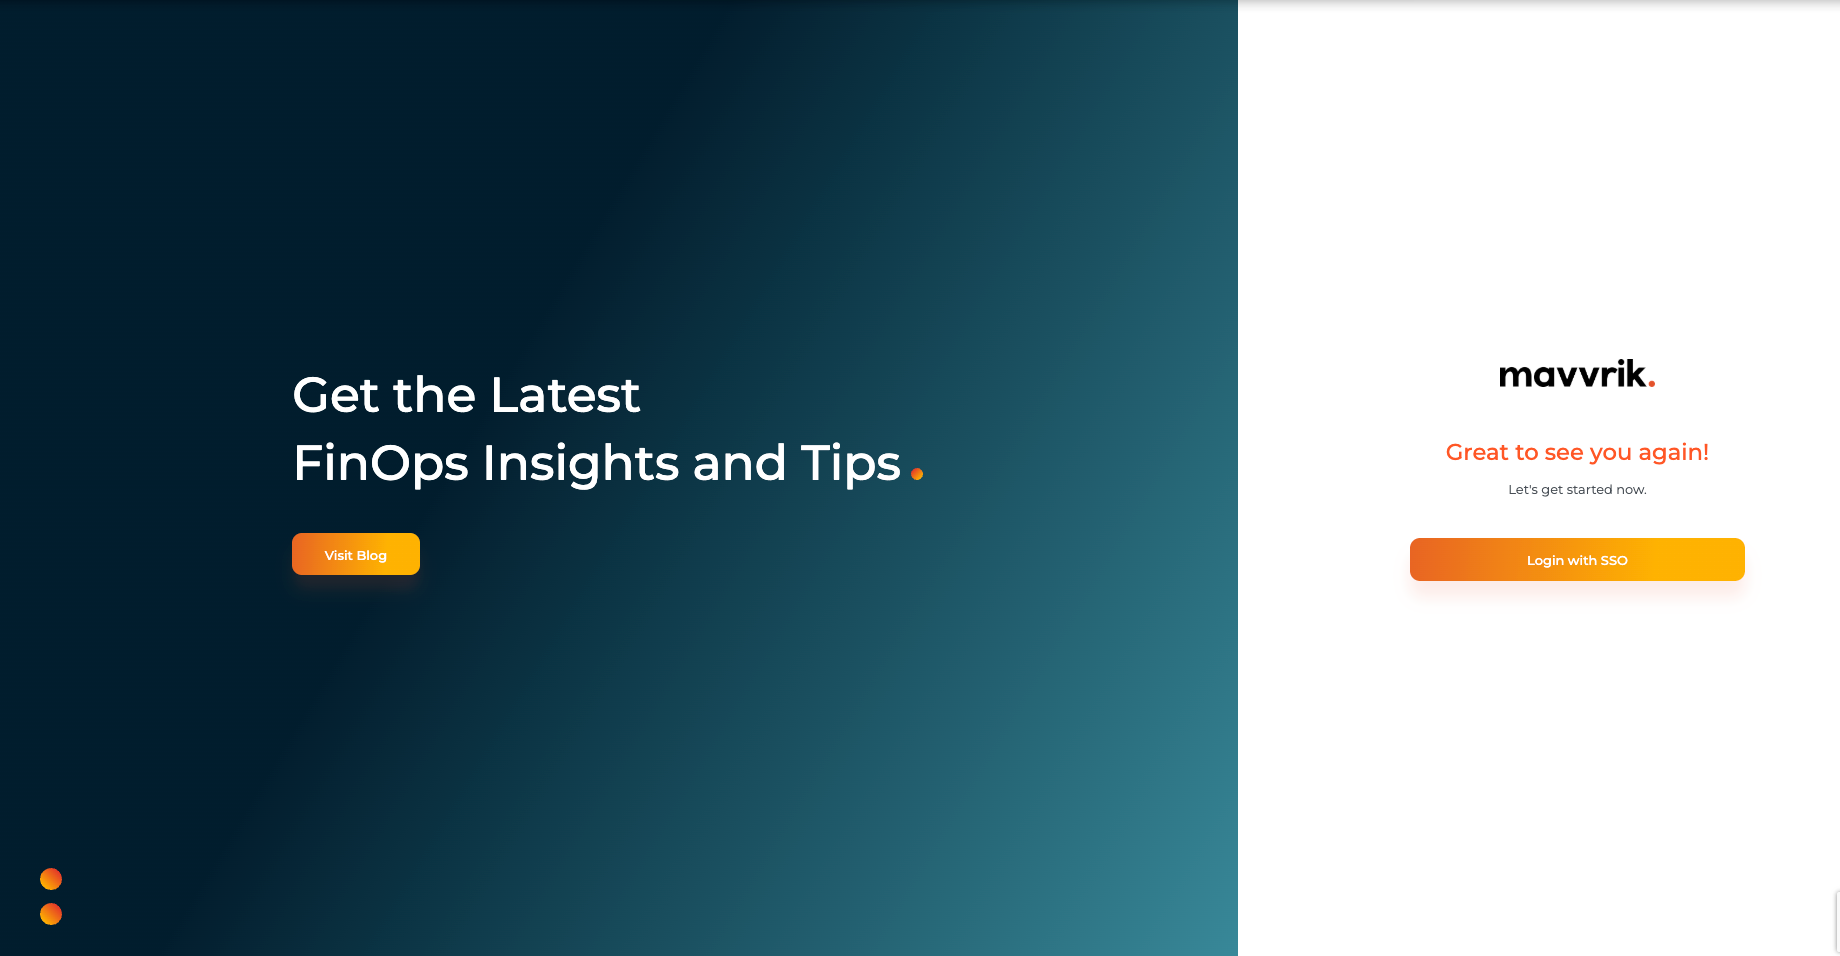
Mavvrik Branding Updates
Our UI and documentation now reflect our Mavvrik identity:
-
New Login Splash Page: Featuring the Mavvrik logo, colors, and convenient blog access
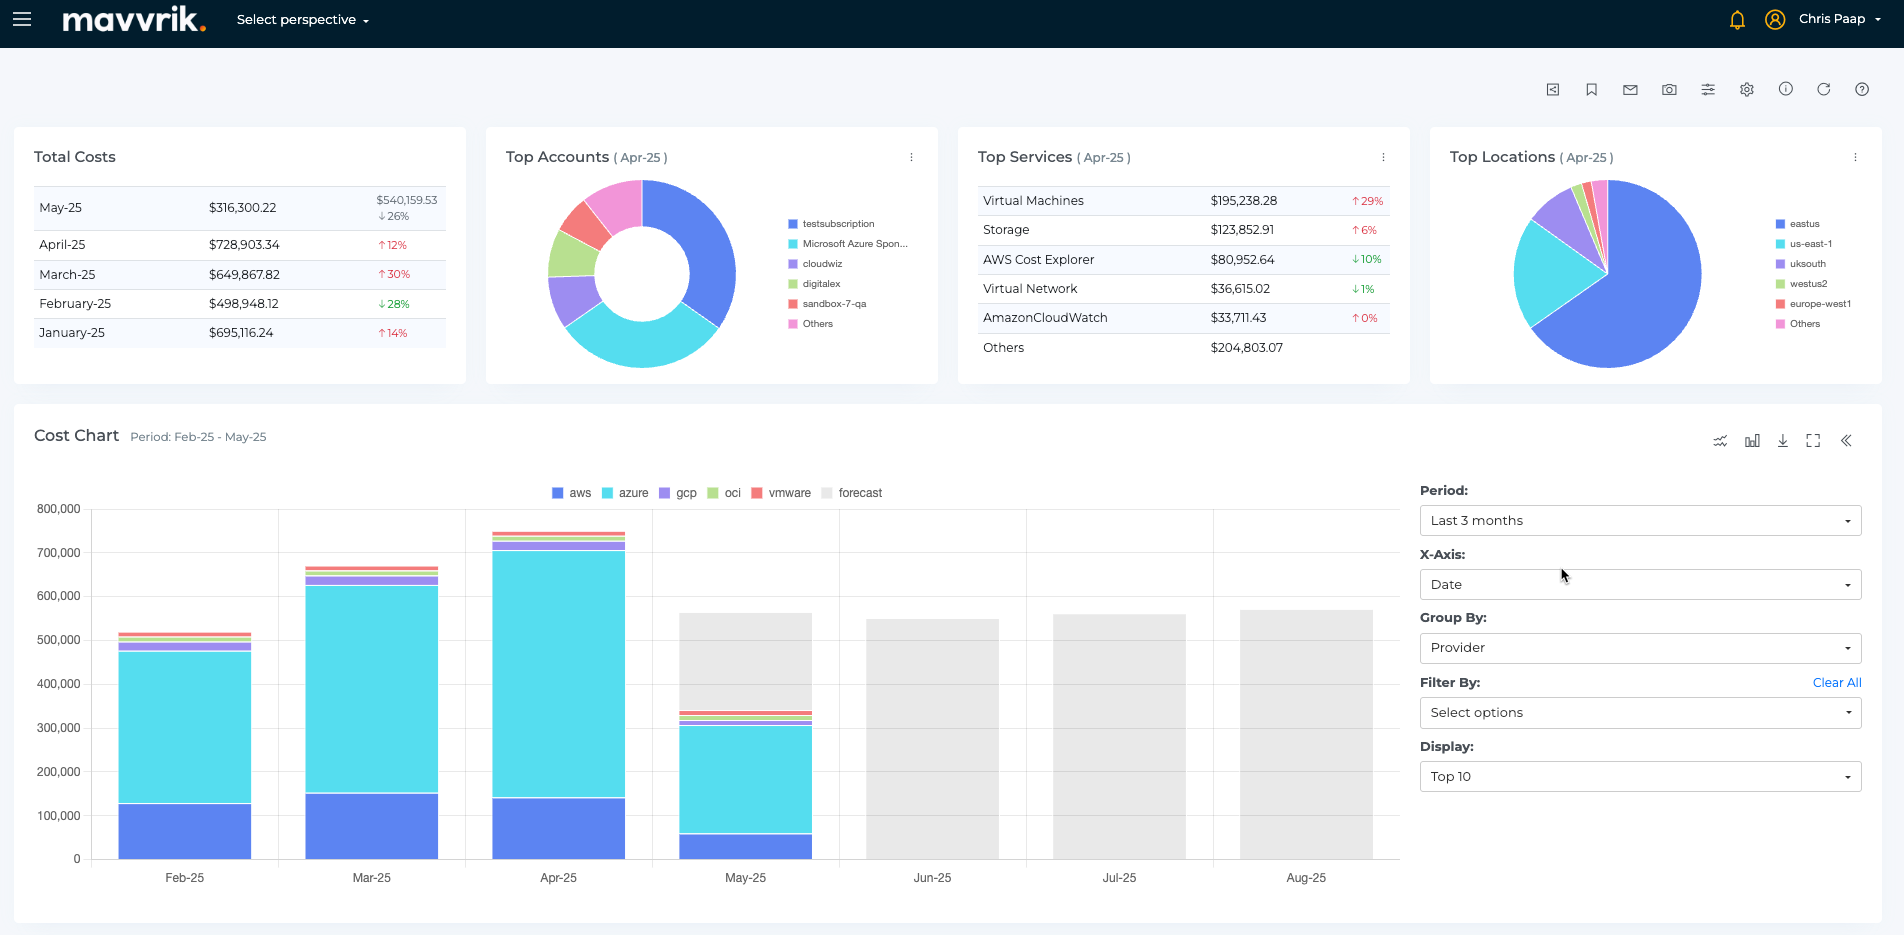
-
Dashboard Branding: Headers updated with the Mavvrik logo and refreshed color scheme
-
Domain Redirect:
-
help.digitalex.io now redirects to help.mavvrik.ai
-
All digitalex.io domains redirect to mavvrik.ai in your app
-
API endpoints have changed: https://api.digitalex.io → https://api.mavvrik.ai and https://graphql.digitalex.io → https://graphql.mavvrik.ai
-
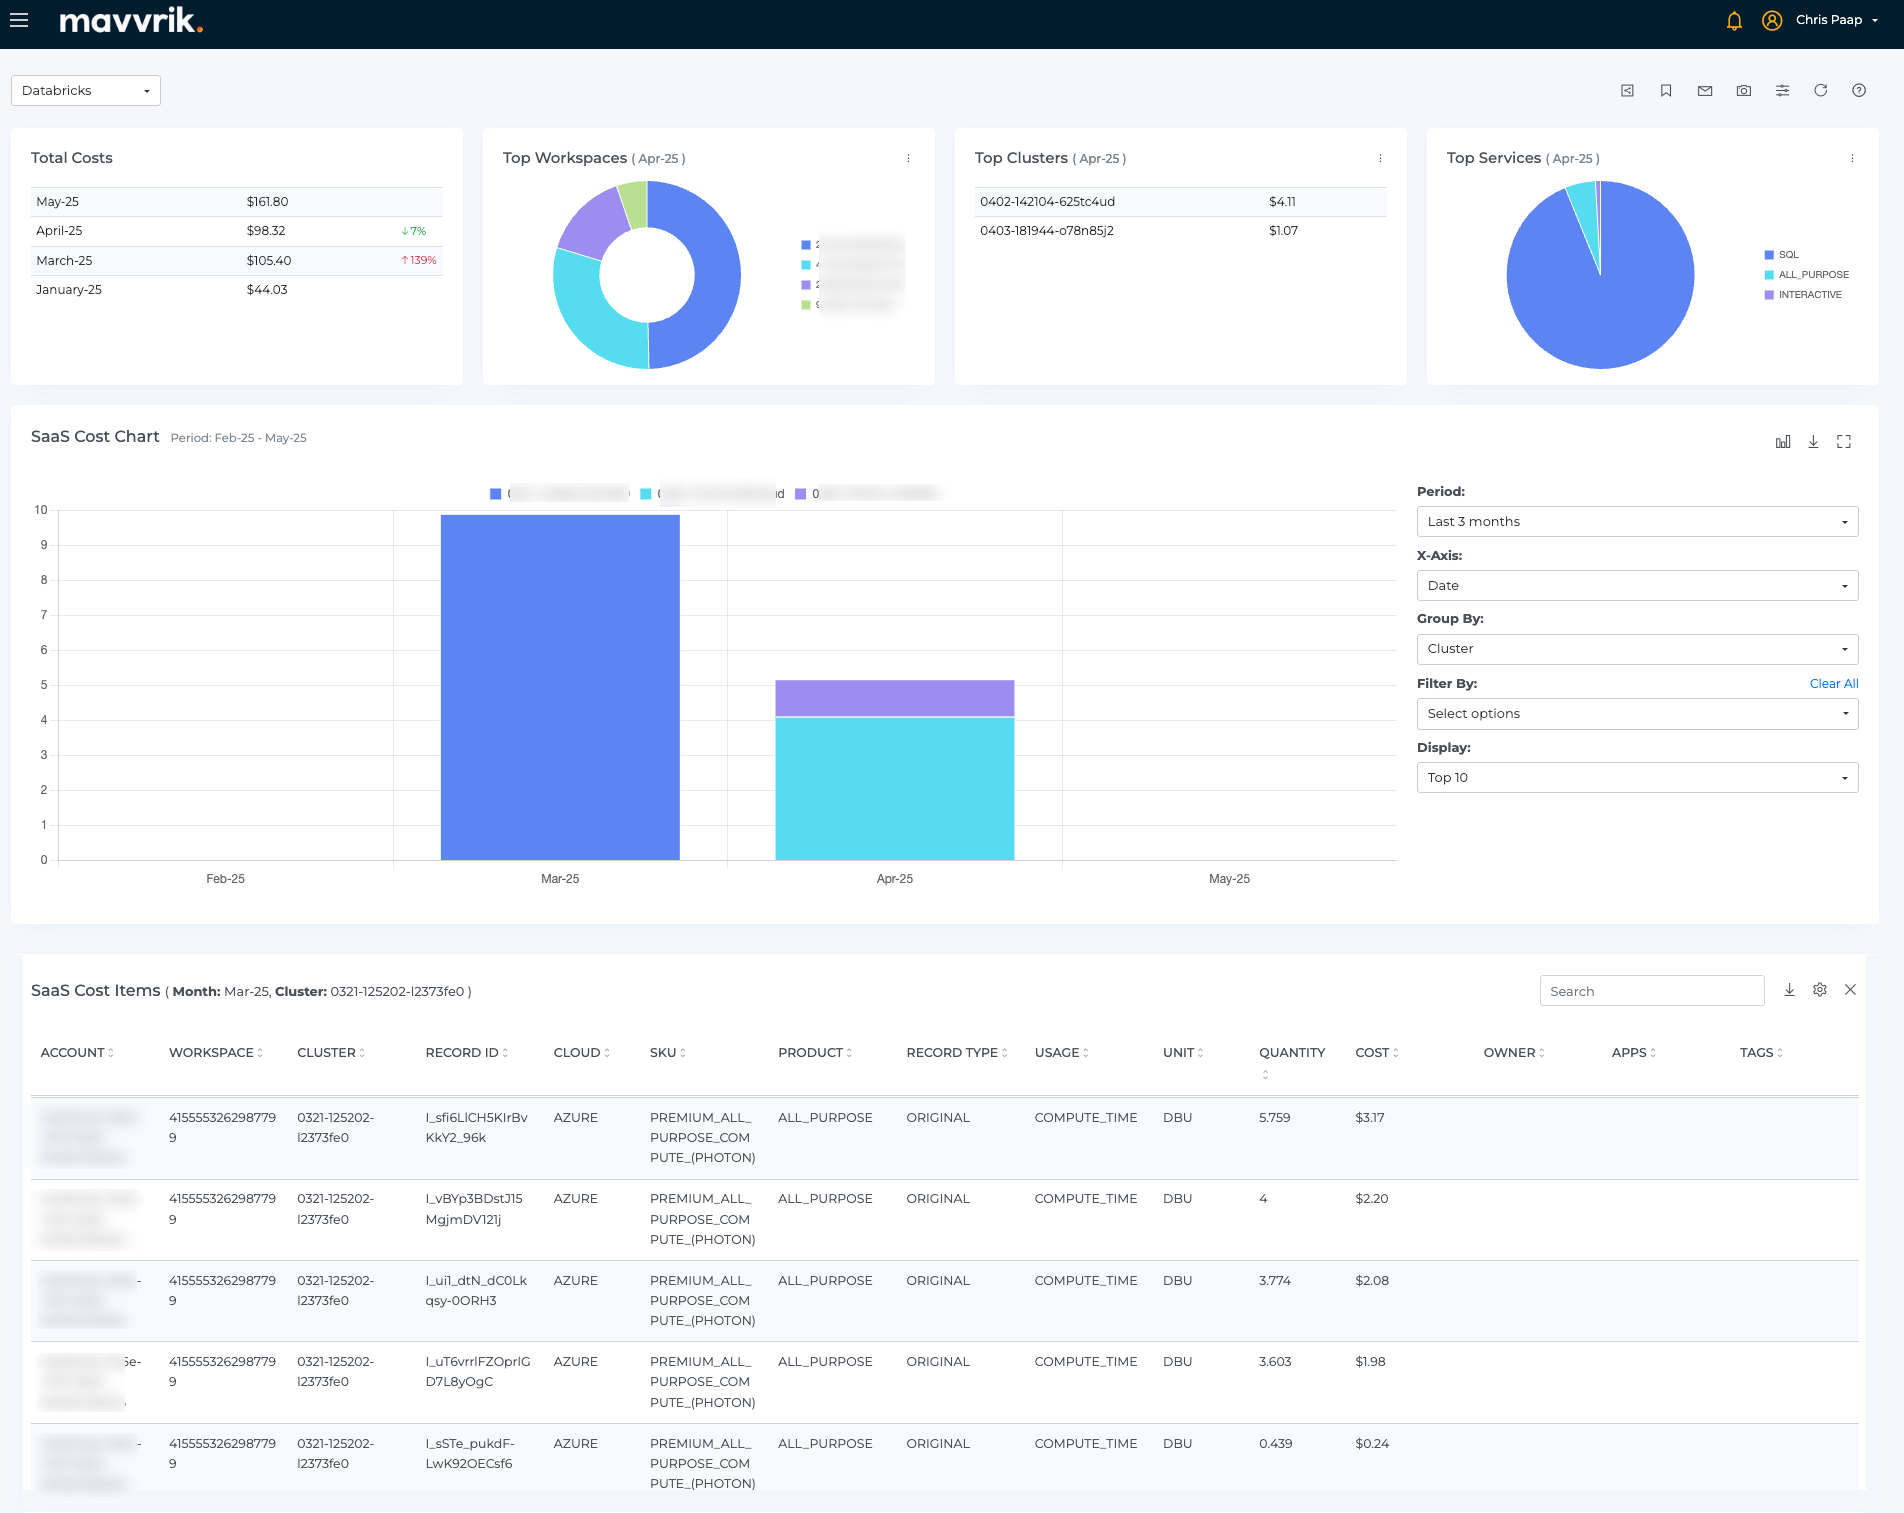
Databricks Integration – SaaS Cost Visibility
We've launched our powerful new connector framework, enabling Mavvrik to ingest cost data from virtually any source. Databricks is the first of many integrations to come on this extensible platform. The framework provides native support for Databricks, enabling users to gain full visibility into associated SaaS costs directly within the platform.
-
Connect Databricks: Seamlessly link your Databricks account using secure credentials to ingest cost and usage data.
-
Detailed Cost Insights: Visualize granular Databricks spend by workspace, SKU, and resource.
-
SaaS Dashboard Integration: Databricks costs are now consolidated in our dedicated SaaS dashboard, giving you a single view of all your third-party cloud services alongside core infrastructure. This unified visibility eliminates blind spots and enables true end-to-end cost management.
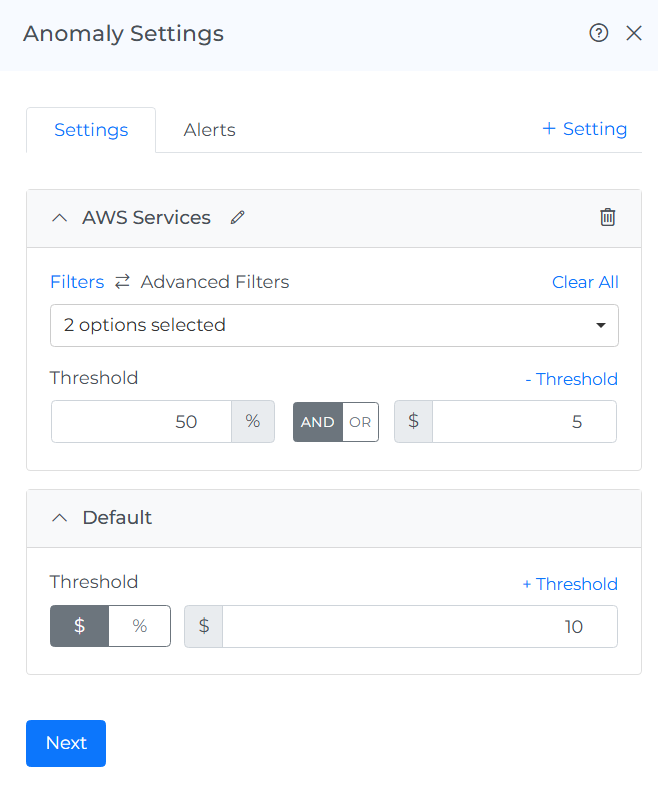
Anomaly Detection – Multi Threshold Support & Granular Filtering
We've completely reimagined the Anomaly Detection experience that puts you in control. Anomaly Settings now include an intuitive interface for configuring alerts, thresholds, and filter criteria so you can precisely target cost anomalies that matter to your business.
-
Granular Filtering: Apply basic or advanced filters based on Provider, Billing Account, Usage Account, Service, Resource Group, and more—enabling highly targeted anomaly detection across your cloud environment.
-
Flexible Threshold Options: Set alert thresholds using fixed dollar amounts or percentages to match your risk tolerance and budget governance policies.
-
Context-Aware Management: Easily manage multiple alert configurations by selecting the settings for tailored governance across different segments of your cloud footprint.
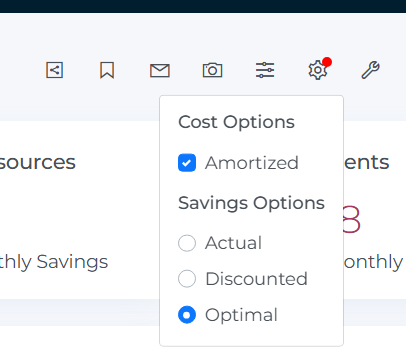
Native Recommendations – Enhanced Savings Breakdown
We’ve expanded our Native Recommendations feature to provide a more nuanced view of cost-saving opportunities, helping teams make better-informed decisions.
-
Actual (Monthly Savings): Shows potential savings based on on-demand pricing, representing the gross value of acting on the recommendation.
-
Discounted (Monthly Amortized Savings): Displays savings calculated using actual discounted pricing (e.g., SPs/RIs), giving a more accurate reflection of financial impact.
-
Optimal Savings: Highlights the best-case savings possible if workloads were perfectly aligned with cost-efficient options using on-demand pricing as the baseline.
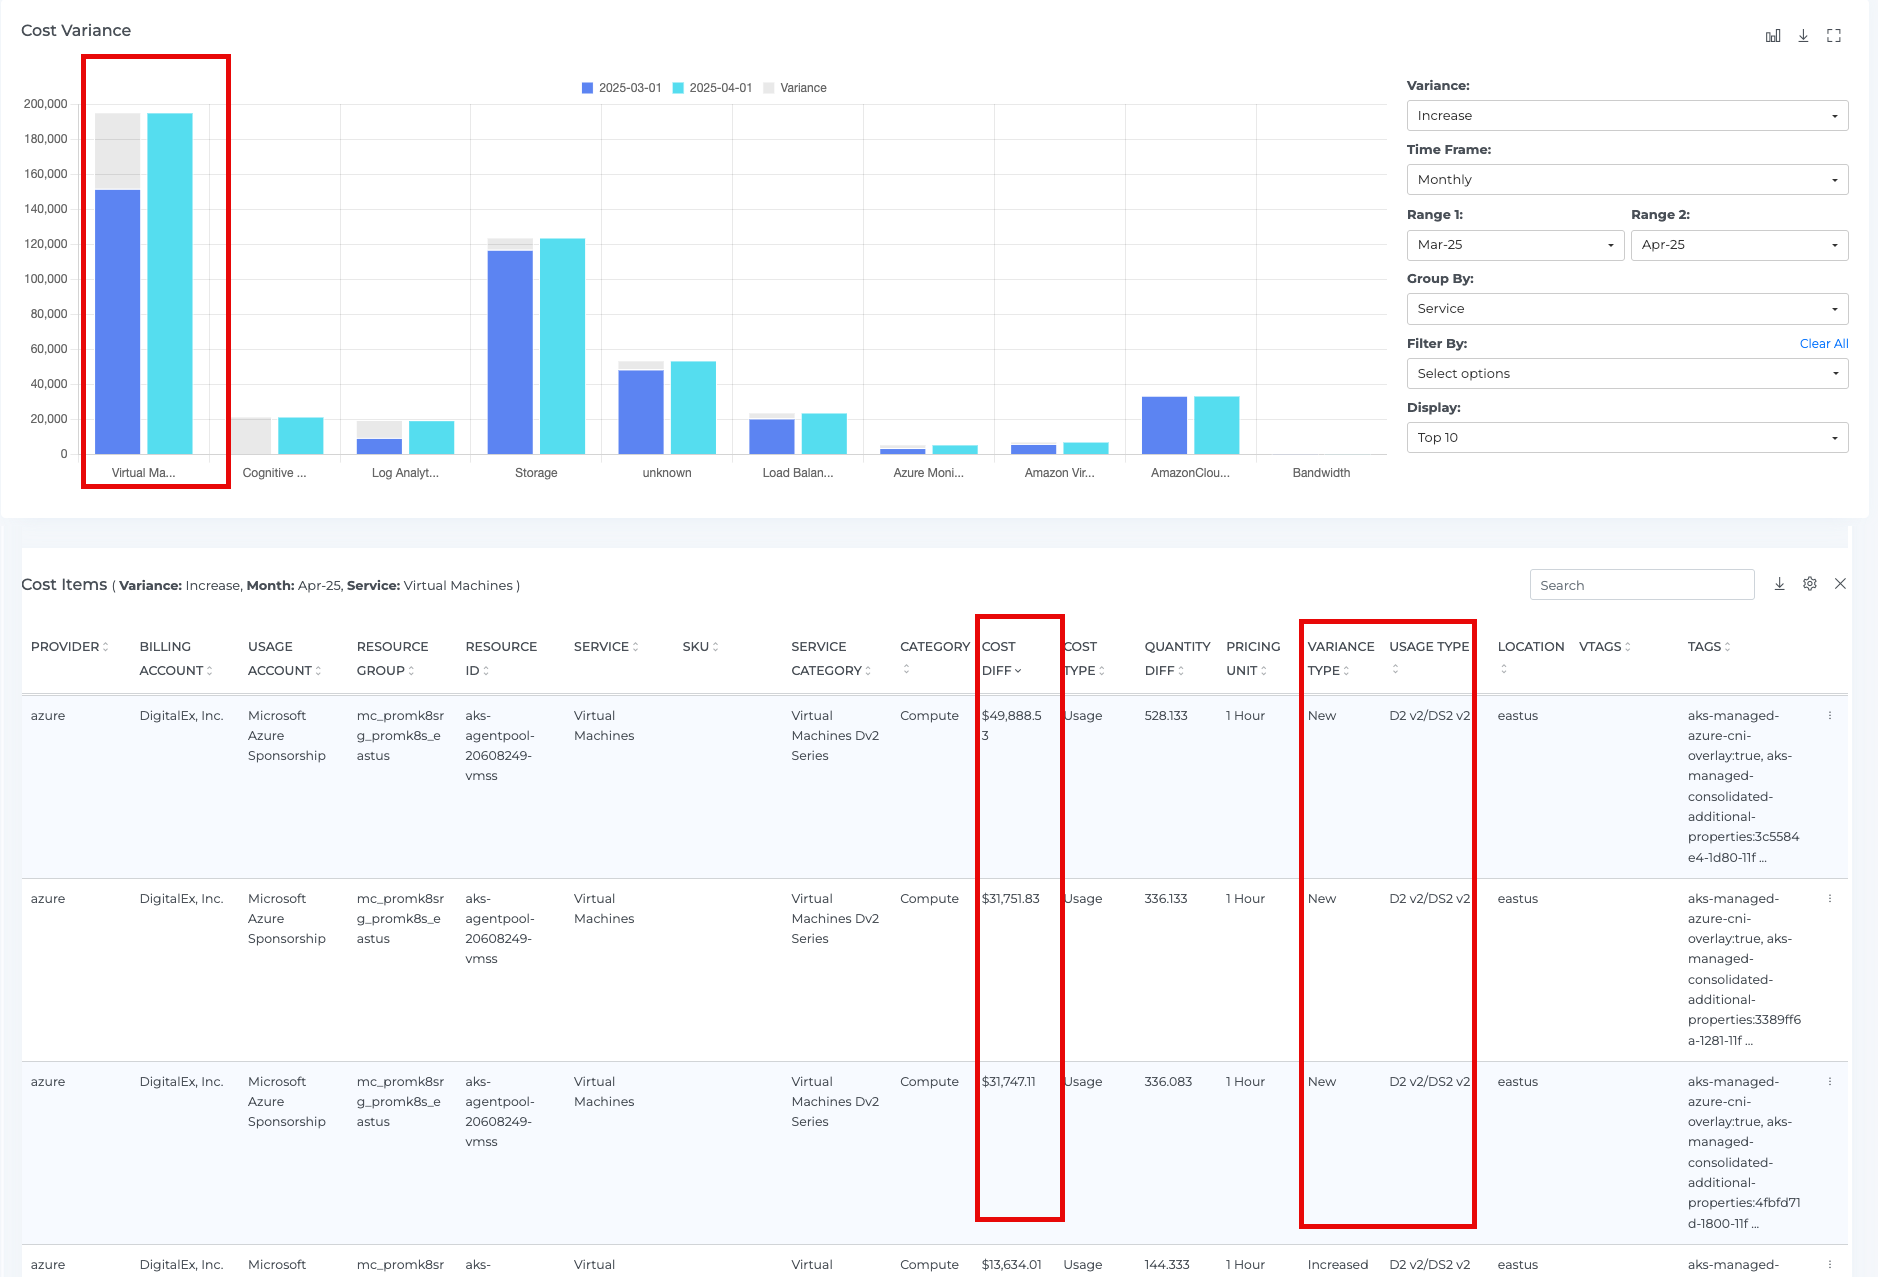
Cost Variance Breakdown – Contextual Usage & Cost Comparison
We’ve significantly enhanced the Cost Variance dashboard to provide deeper, more actionable insights into monthly spend fluctuations by comparing changes across time periods.
-
Side-by-Side Comparison: When users click on a variance bar (e.g., March), the breakdown now compares usage and cost directly against the previous period (e.g., February).
-
Change Classification: Each resource is tagged with a clear status—Increased, Decreased, New, Deleted, or Unchanged—making it easier to interpret the nature of the change.
-
Detailed Delta View: Displays both usage differences (e.g., hours, storage) and cost differences, so users can identify whether a change is driven by consumption, pricing, or both.
-
Sorted by Impact: Results are sorted by absolute cost variance (highest to lowest) to spotlight the most material changes first.
AI Insights Dashboard – Now Supports Azure AI Foundry
We’ve extended our AI Insights Dashboard to include support for Azure AI Foundry, providing broader visibility into your AI cost landscape.
-
Expanded Model Coverage: Gain visibility into Azure AI Foundry usage along side Azure Open AI, with detailed insights into cost, performance, and consumption trends.
-
Unified AI Cost Governance: Monitor Azure AI Foundry workloads within the same dashboard, enabling consistent optimization strategies across all your generative Azure AI services.
-
Foundry-Specific Metrics: Track usage patterns and cost drivers unique to Azure AI Foundry to inform rightsizing and scaling decisions.
Platform Experience Enhancements
Cloud as Default Data Source: We've updated the default Data Source selection to Cloud across Budgets, Alerts, and Cost Allocations for a more intuitive user experience.
Azure Amortization Support for CSP & Non-Billing Scopes: We’ve added azure amortization support for CSP and other non-billing scopes, enabling more accurate cost reporting across different account structures. This ensures consistent visibility into commitment-based spend, regardless of scope type.
GCP Negotiated Savings Support :The Cost Dashboard now includes GCP Negotiated Savings as part of the existing Taxes & Credits breakdown, providing a more accurate view of your true effective costs.
Disabled Status for Datacenters & K8s Clusters : We've extended the Disabled status option to both Datacenters and Kubernetes Clusters, in addition to existing support for Cloud. This helps suppress alerts for decommissioned infrastructure while maintaining historical data visibility.
Virtual Tag Support in Cost Allocation : Cost Allocation auto-discovery now supports Virtual Tags alongside Usage Accounts and native Tags, enabling more flexible and consistent cost attribution.