.png)
We’re excited to announce our August 2025 release! This update adds Confluent integration and an All Providers view on the SaaS Cost page for consolidated spend insights. Cost Allocations are now faster and support export/import for easier sharing. Platform Experience Enhancements include dashboard sharing, tag support on the GenAI page, and a new side panel on the SaaS Cost page for detailed insights.
For more details, please reach out to your Mavvrik representative or check our updated documentation https://help.mavvrik.ai/
|
Release Version |
Features |
|---|---|
|
Release-2025.08.13 |
|
Track LLM cost with AWS Inference Profiles
Now you can see which teams, apps, or environments drive your Bedrock costs—without extra tagging—using AWS Inference Profiles
Mavvrik automatically pulls tags from these profiles (e.g., team=mlops, app=chatbot) so GenAI spend shows up in dashboards by application, team, or environment—no pipeline changes or manual tagging required.
Example: A single Claude endpoint can report separate costs for app=internalRAG vs. app=chatbot just by routing through different tagged profiles.
Mavvrik supports this natively, giving FinOps and platform teams clear visibility into who’s using which model, how often, and at what cost.
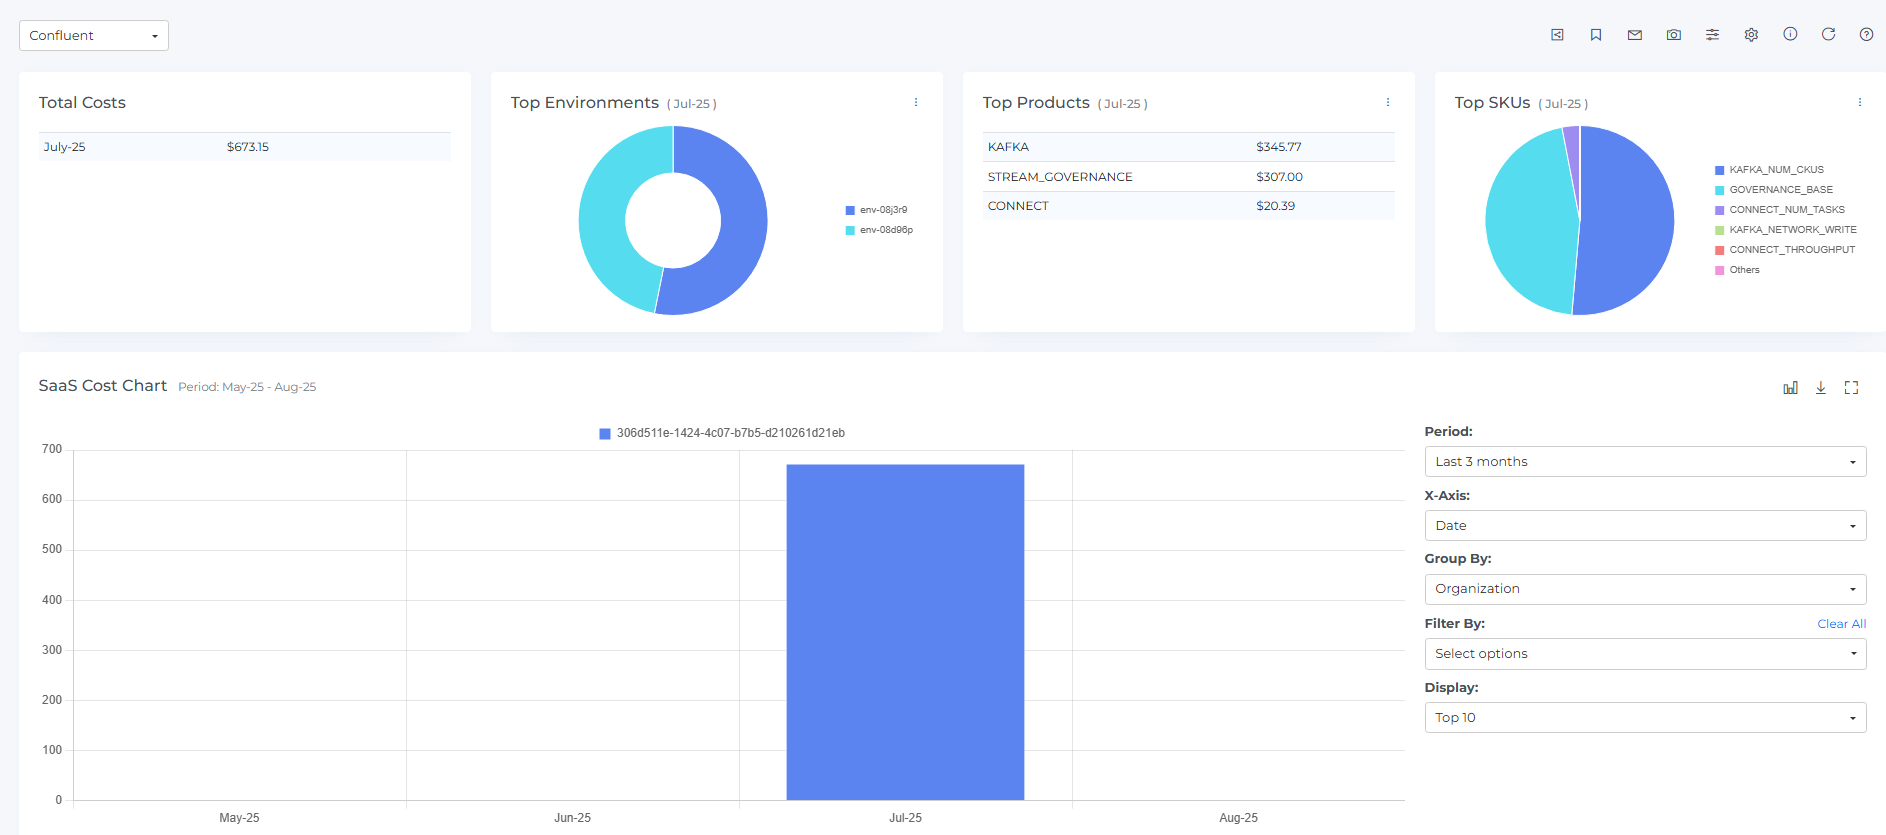
Confluent Integration – SaaS Cost Visibility
As part of our expanding SaaS integration portfolio, we’ve introduced native support for Confluent in the SaaS cost dashboard. This addition gives you complete visibility into your Confluent spend with powerful drill-down capabilities.
-
Connect Confluent: Securely link your Confluent account to ingest cost and usage data.
-
Detailed Cost Insights: View spend by environments, products (Kafka, Stream Governance, Connect), and SKUs for precise cost attribution.
-
SaaS Dashboard Integration: Confluent costs now appear in your dedicated SaaS dashboard, alongside Snowflake, MongoDB, and other integrations, giving you unified third-party cloud spend visibility.
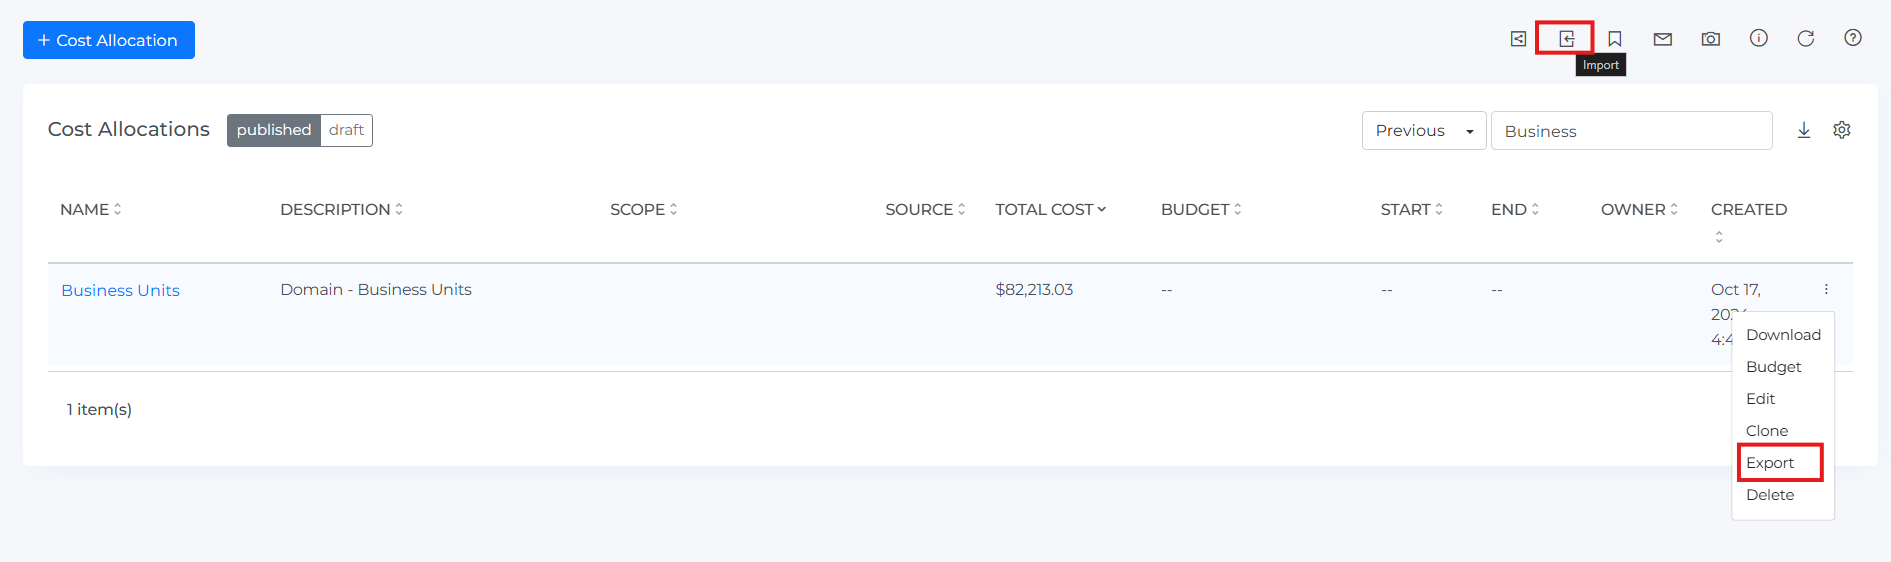
Cost Allocation Enhancements
We’ve delivered key updates to improve Cost Allocation speed, usability, and flexibility:
-
Faster Recalculation: Optimized processing significantly reduces the time to recalculate cost allocations after they are created or modified.
-
Export & Import: Export cost allocation configurations for backup or sharing, and import them to quickly recreate or update cost allocations.
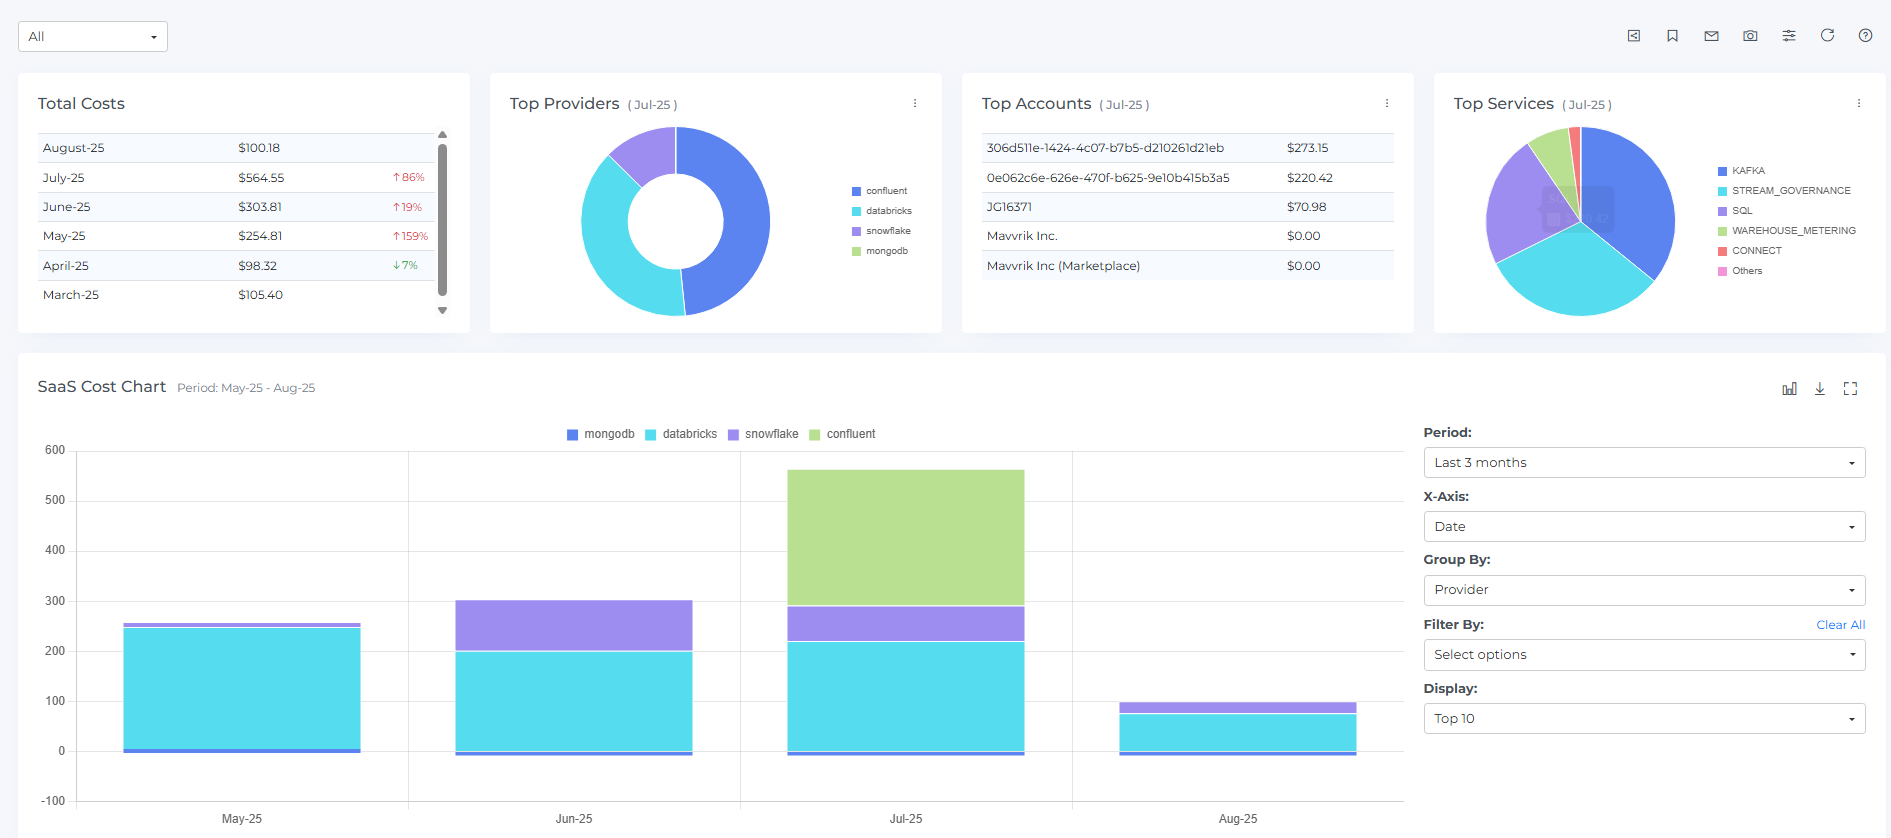
SaaS Cost – Overview Dashboard
We’ve enhanced the SaaS Cost page with a new All option, allowing you to view combined cost data across all integrated SaaS providers in one place.
-
Unified View: See a consolidated overview of total SaaS spend without switching between providers.
-
Faster Analysis: Quickly compare and analyze cost distribution across services like Confluent, Databricks, MongoDB, Snowflake, and more.
-
Streamlined Workflow: Reduces navigation steps, making it easier to spot trends and optimize multi-SaaS spend.
Platform Experience Enhancements.
GenAI page - Tag Filter Support
Filter GenAI spend using your existing cloud tags.
-
AWS: Tags from Application Inference Profiles (e.g.
team=mlops,env=prod) auto-appear when invoked via profile ARN. -
GCP: Project-level labels are used for grouping.
-
Azure: Tags from the resource or resource group are applied.
Quickly break down spend by customer, feature, or environment. Use tag-based views to improve showback, chargeback, and budget reviews.
Custom Dashboard – Sharing
We’ve added new collaboration capabilities to Custom Dashboards. Users can now share their dashboards with team members to align on metrics, monitor the same KPIs, and drive collaborative decision-making.
SaaS Cost Page – Side Panel Details
We’ve added support for a side panel in the main line item table, allowing users to view complete details for each row, including all associated tags and virtual tags.