.png)
The May 2026 release expands Mavvrik’s AI and FinOps coverage with MCP Server support, Cost and usage tracking for Claude Code and Claude Cowork, spend-based GCP CUD inventory, standardized GenAI cost visibility, and broader Azure AI Foundry provider coverage. This cycle also improves Cost Allocation with partial shared cost allocation and fairer RI/SP distribution logic, alongside updates to Custom Dashboards, Unit Economics, Ticketing & Backlog, and Databricks workspace visibility.
For more details, please reach out to your Mavvrik representative or check our updated documentation Help Center
|
Release Version |
Features |
|---|---|
|
Release-2026.05.13 |
|
Mavvrik MCP Server: Claude Integration
Ask cloud cost questions in Claude and get answers from your Mavvrik data - without opening a dashboard.
Mavvrik MCP connects Claude Web and Claude Desktop to your Mavvrik tenant. You can ask questions about cloud spend, cost changes, anomalies, and savings recommendations in a normal conversation, and Claude responds using data from your connected tenant. Current coverage includes Cloud Cost, Cost Variances, Recommendations, and Anomalies.
For more details refer: MCP Server Documentation
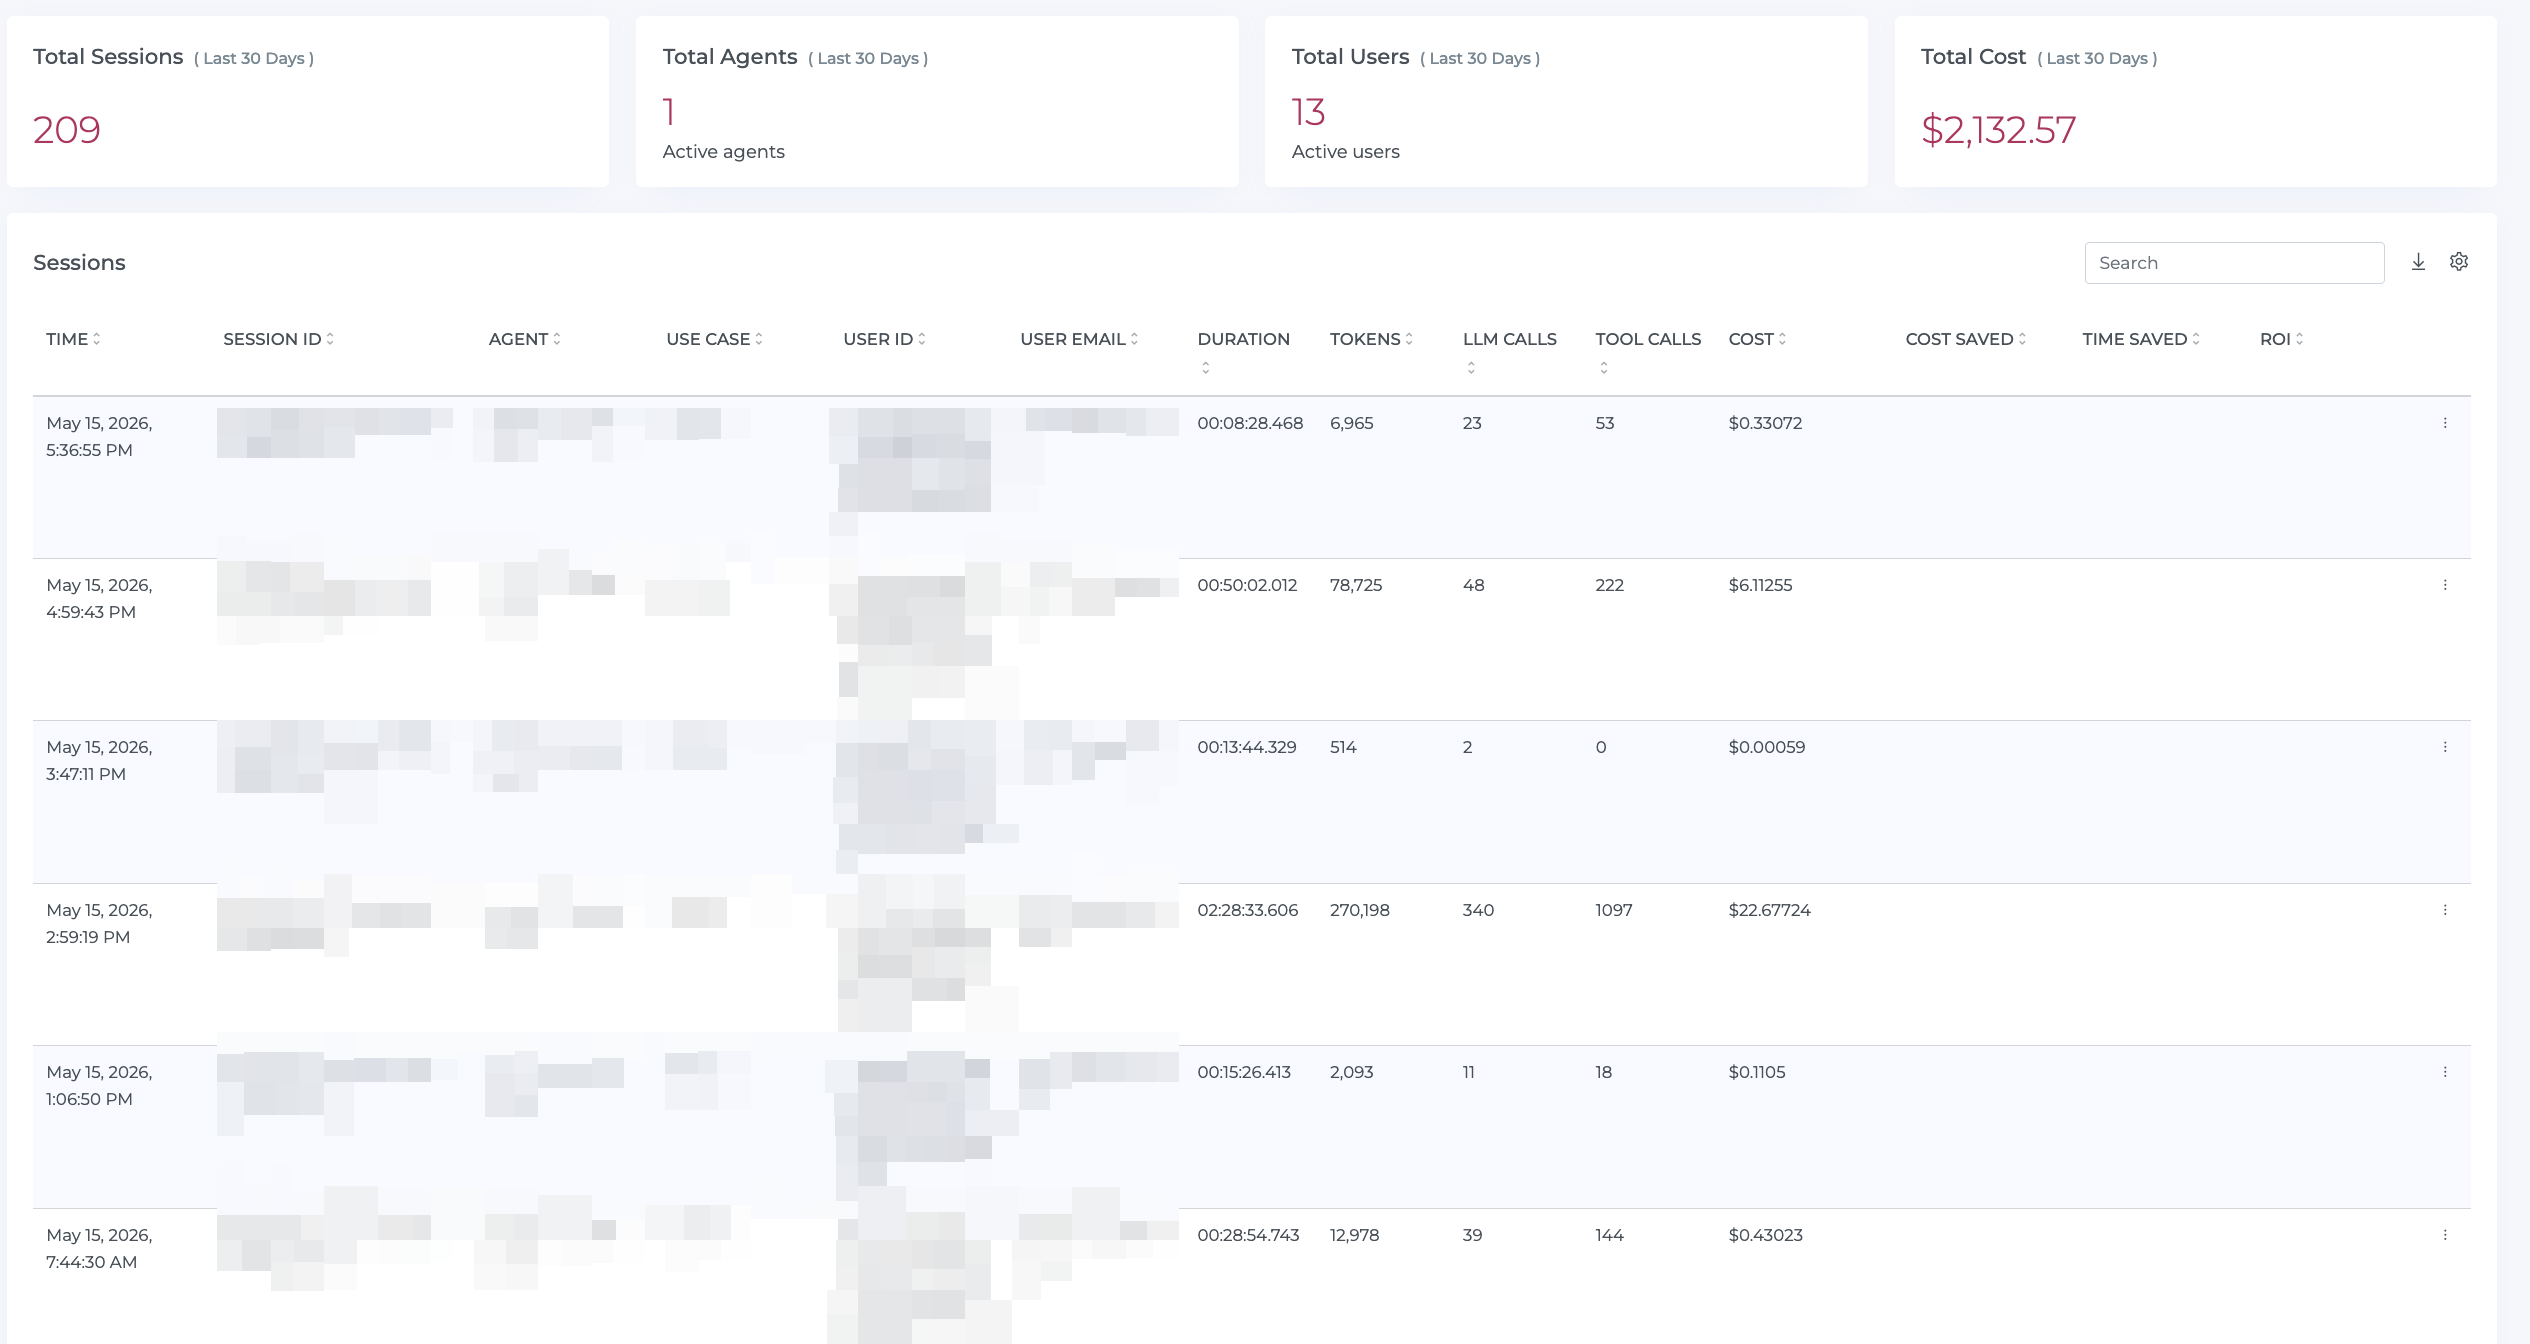
Claude Code and Claude Cowork Cost Tracking
Track cost and usage from Claude Code and Claude Cowork in Mavvrik.
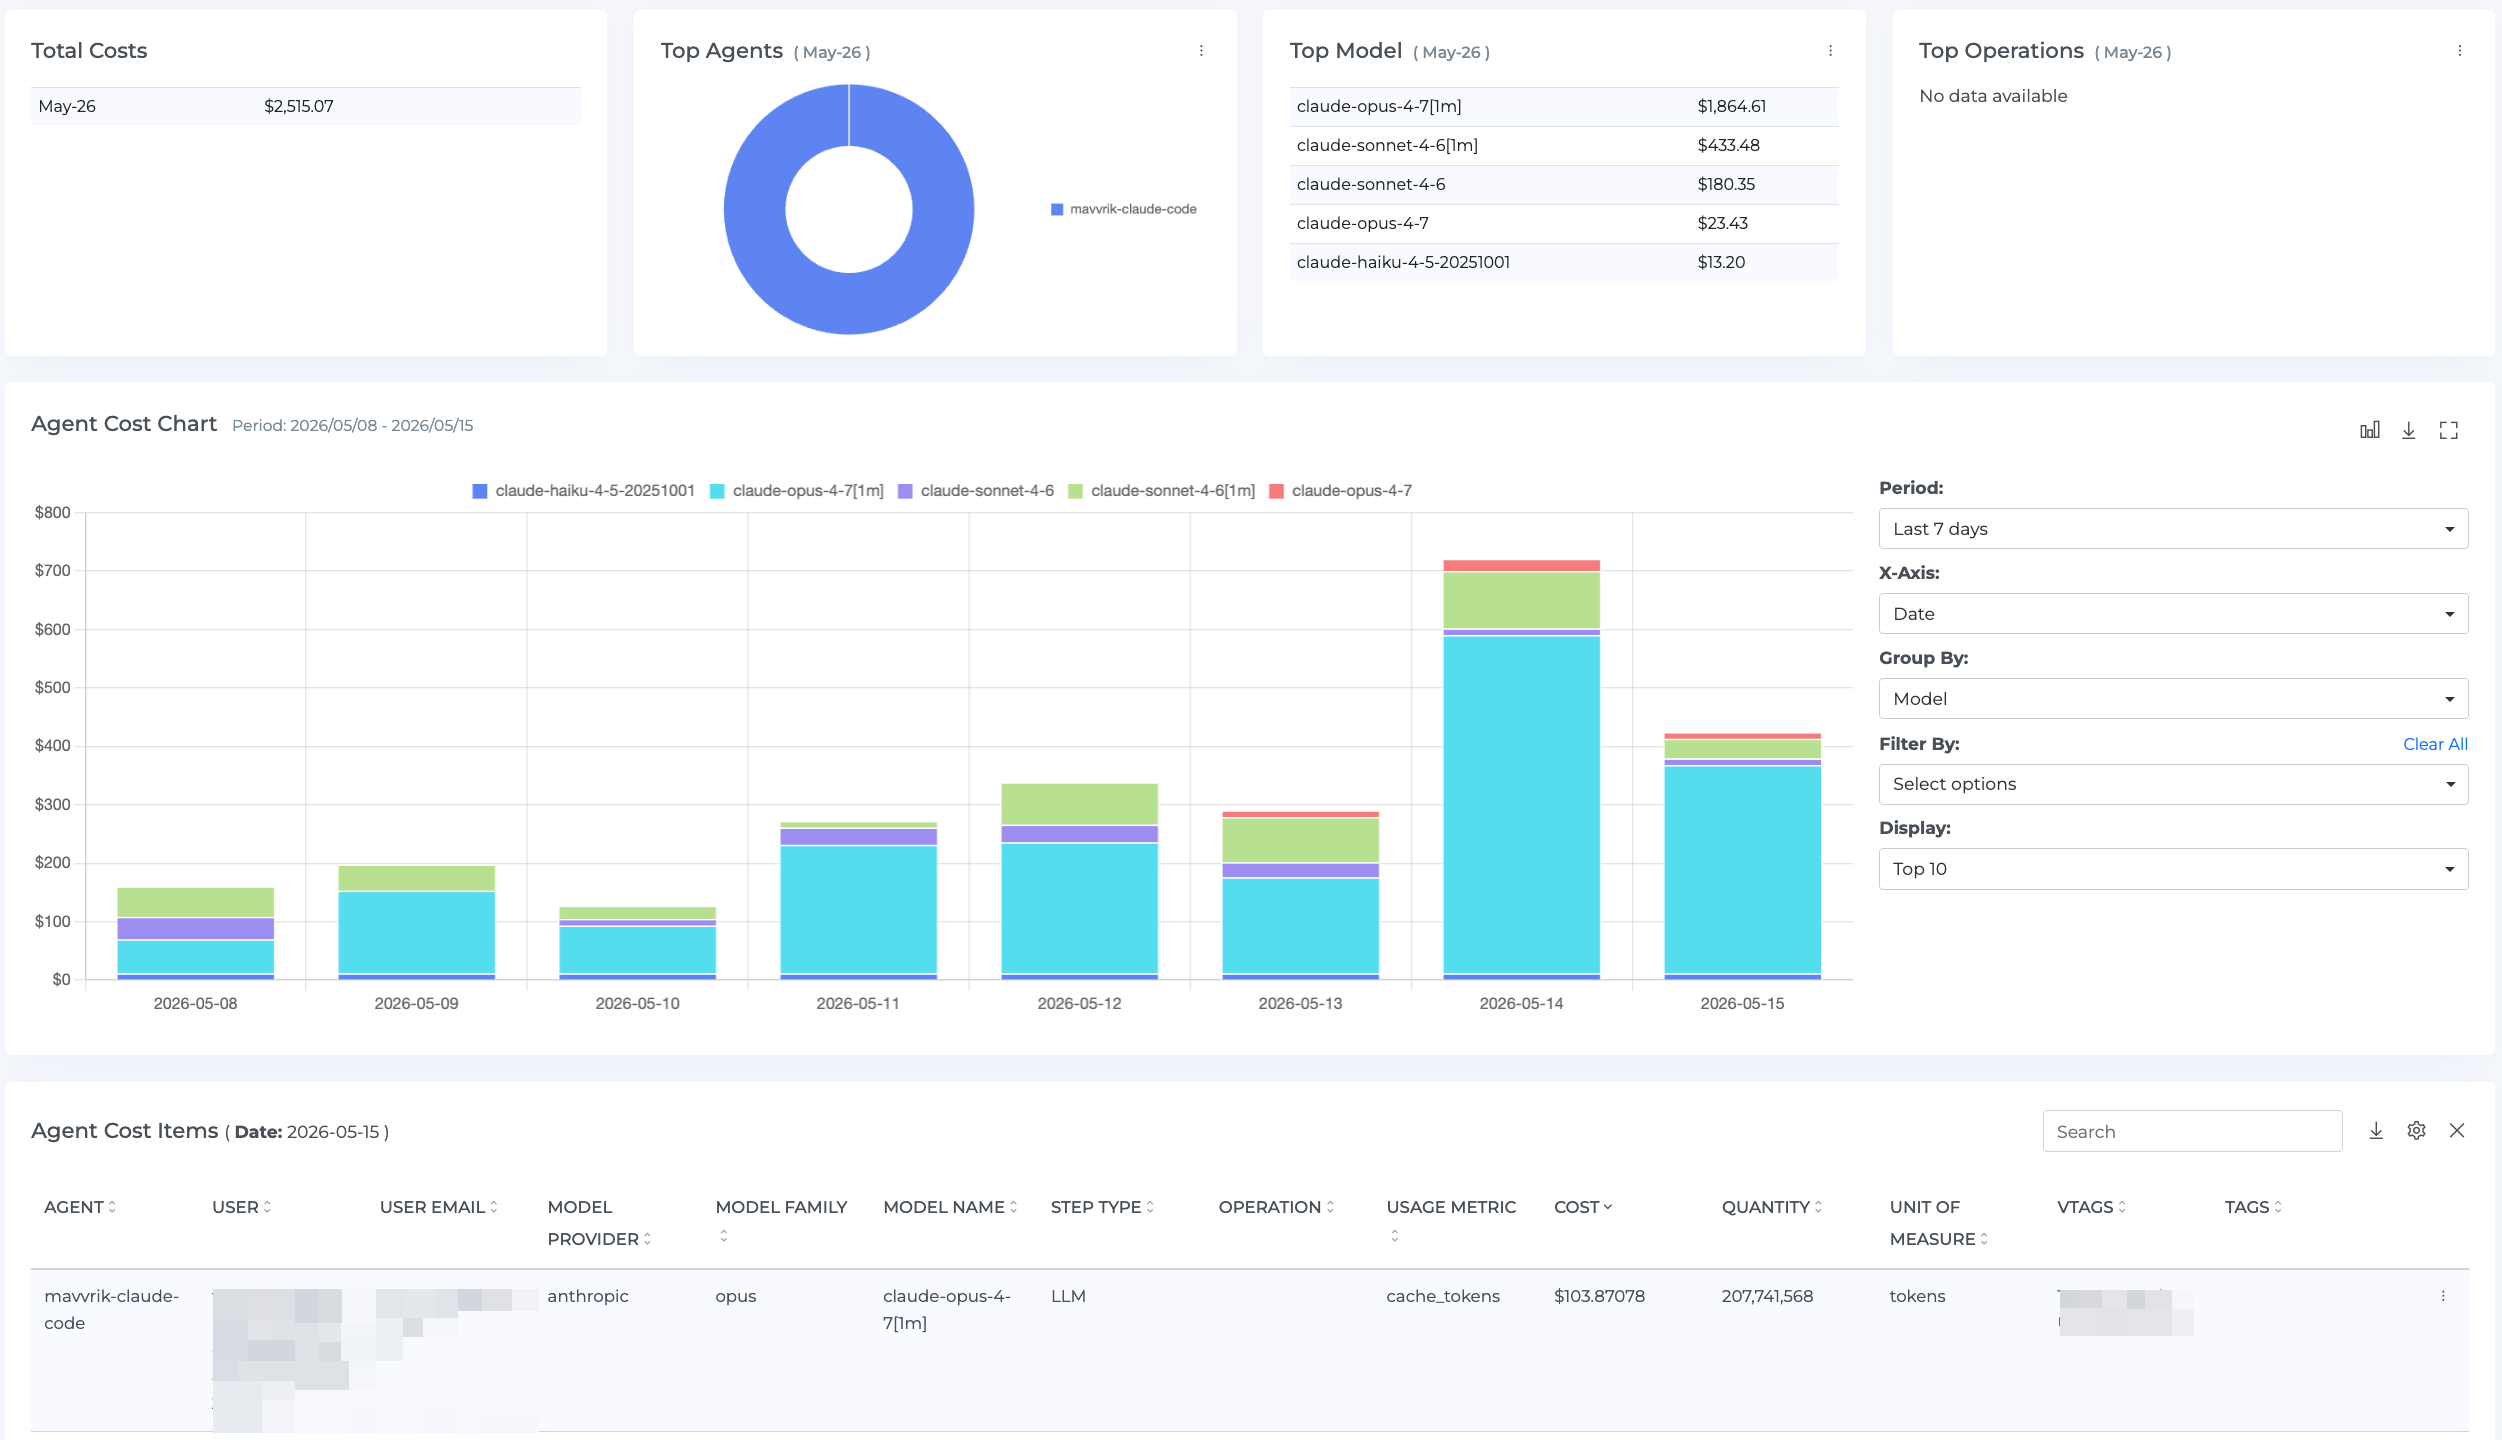
This release introduces cost and usage visibility for Claude Code and Claude Cowork. Teams can view spend by user and session, making it easier to understand consumption patterns and manage costs as AI tool usage grows.
For more details refer: AI Tools Onboarding Documentation
GCP : Spend-Based CUD Inventory
See your GCP Committed Use Discounts with the detail that standard billing exports don't provide.
Spend-based CUD inventory now surfaces term, start and end dates, and expiration directly in the SP Utilization dashboard. Standard GCP billing exports leave these fields out, making it difficult to track commitment status and coverage over time. This fills that gap so teams can manage GCP commitments with the same inventory visibility already available for AWS and Azure.
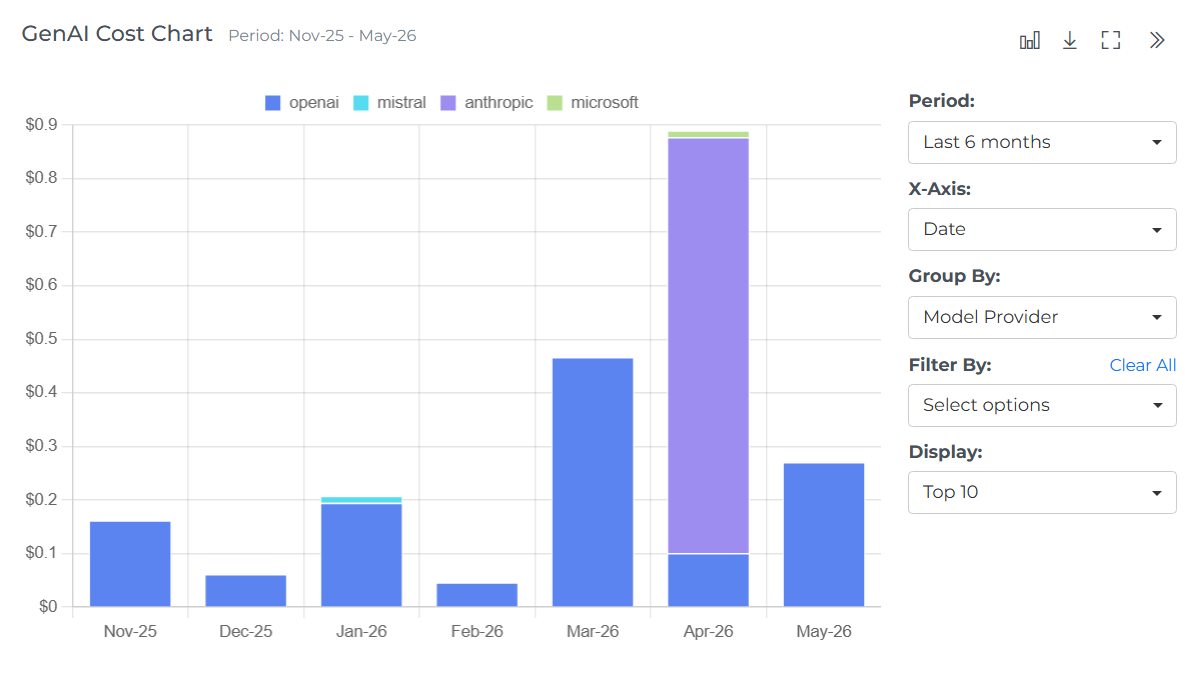
GenAI Dashboard Enhancements
Improve GenAI cost visibility across providers, platforms, and deployment paths.
Standardized Cost Visibility
Improve GenAI cost reporting across providers, platforms, and gateways. Richer attribution fields such as Platform, Gateway, User, and API Key can be surfaced in the GenAI dashboard, making it easier to trace where AI costs come from. Model details are also simplified into a single Model field, with more consistent usage types for cleaner reporting, cost allocation, and governance.
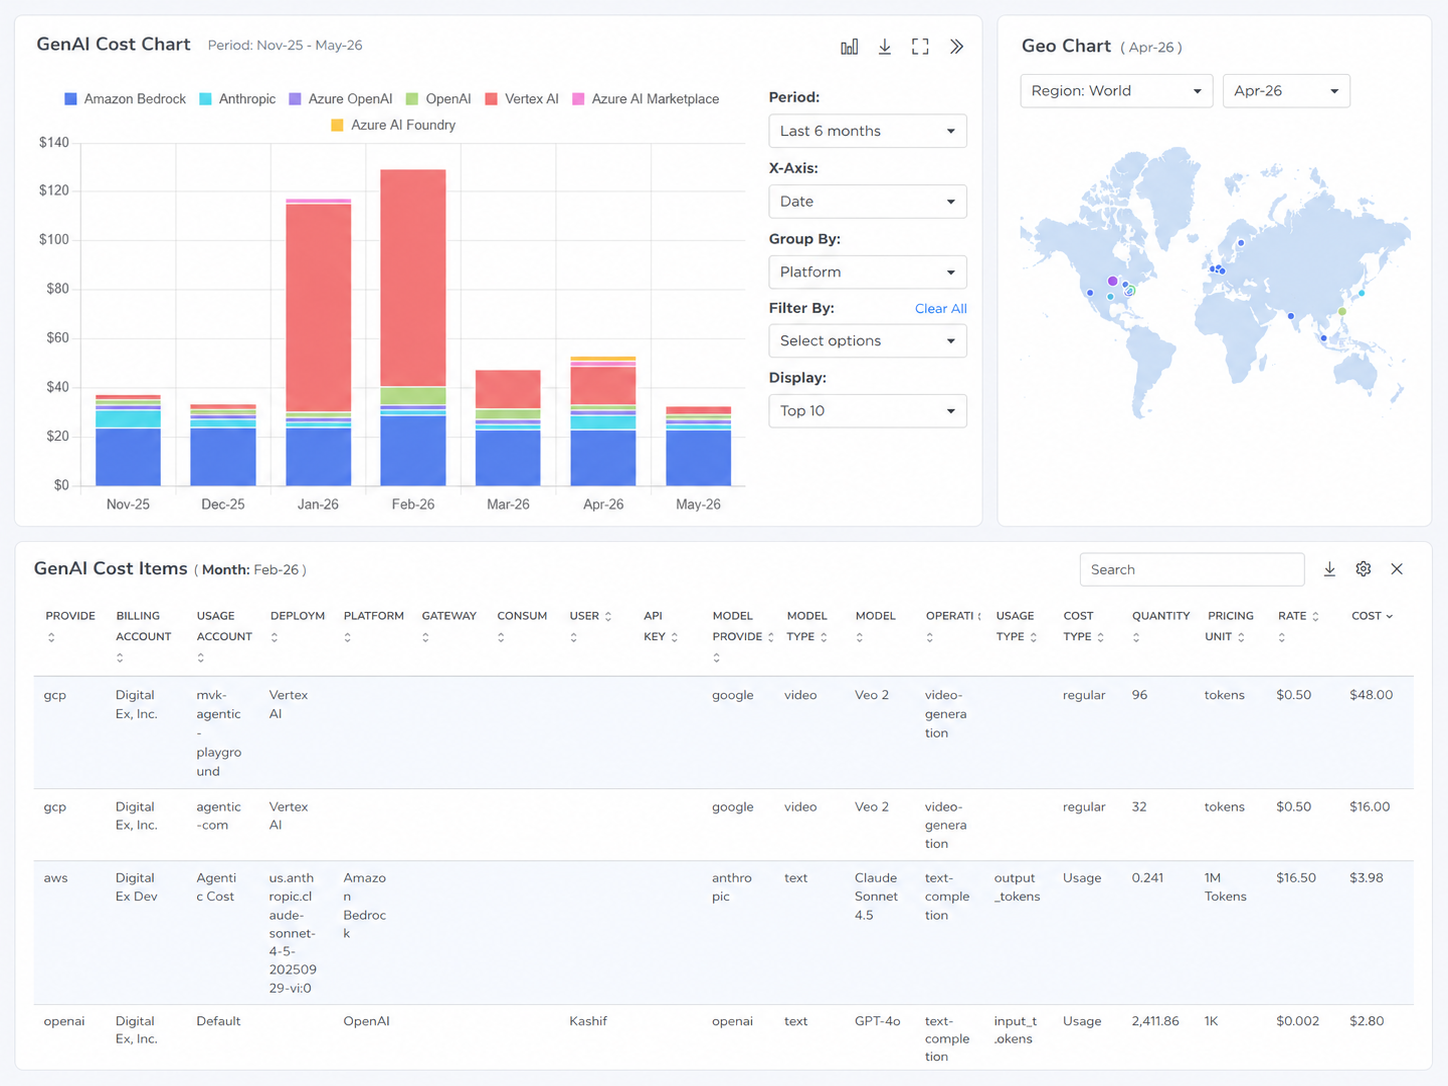
Azure AI Foundry Provider Visibility
Extend Azure GenAI cost visibility beyond OpenAI models. Azure AI Foundry deployments from additional model providers—such as Anthropic Claude, Meta Llama, Mistral, and Cohere—can be surfaced in the GenAI dashboard, helping teams capture a more complete view of Azure-based AI usage and cost across providers, models, and deployments.
Cost Allocation Enhancements
Improve how shared and unused costs are distributed across allocation models.
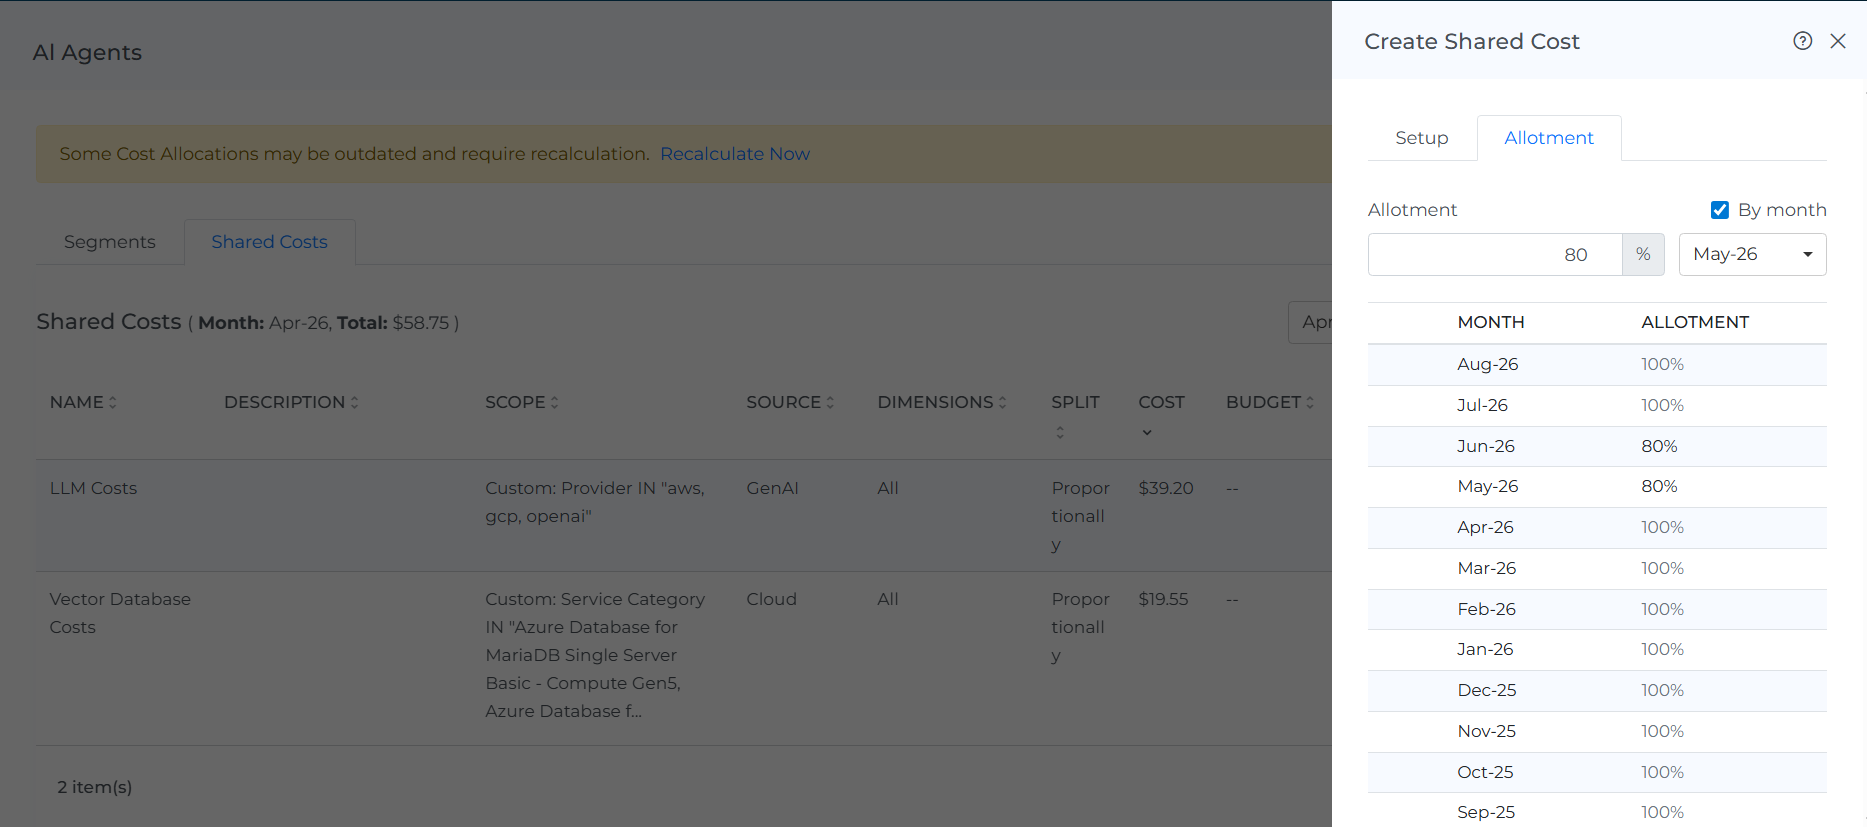
Partial Shared Cost Allocation
Allocate only a portion of selected shared costs across business units, teams, or segments.
Previously, shared costs had to be fully allocated or left out entirely. You can now allocate a defined portion of a shared cost across business units, teams, or segments while leaving the remainder unallocated or handled separately. This makes it easier to model costs accurately when only part of an expense should be distributed - for example, a shared service where only certain teams are responsible for a fraction of the spend.
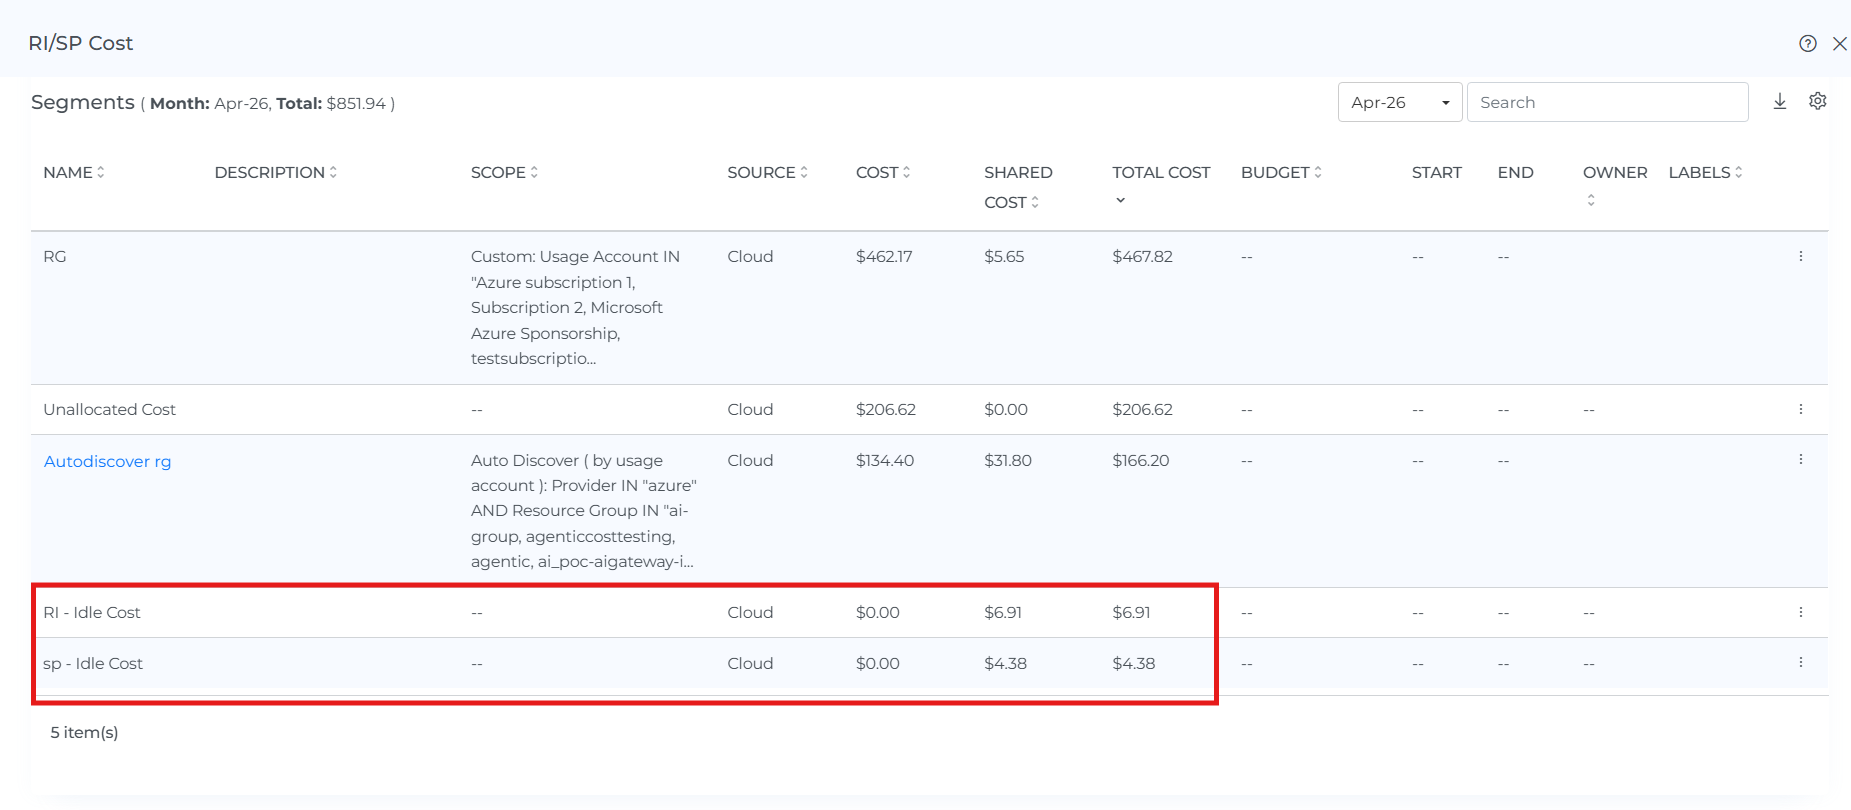
Fair Distribution for RI/SP Costs
RI/SP utilization cost distribution has been refined so only the used portion of commitment costs is allocated across segments. Any unused commitment cost is kept separate and shown as RI - Idle Cost or SP - Idle Cost, making shared cost allocation more accurate and easier to understand.
Custom Dashboard : Enhancements
Expanded Widget View
Stay in context when drilling into a widget.
Expanded widgets now open within the same dashboard view instead of launching a new browser tab. When reviewing trends, variances, or cost drivers in detail, you stay on the same page rather than losing your place in the dashboard layout.
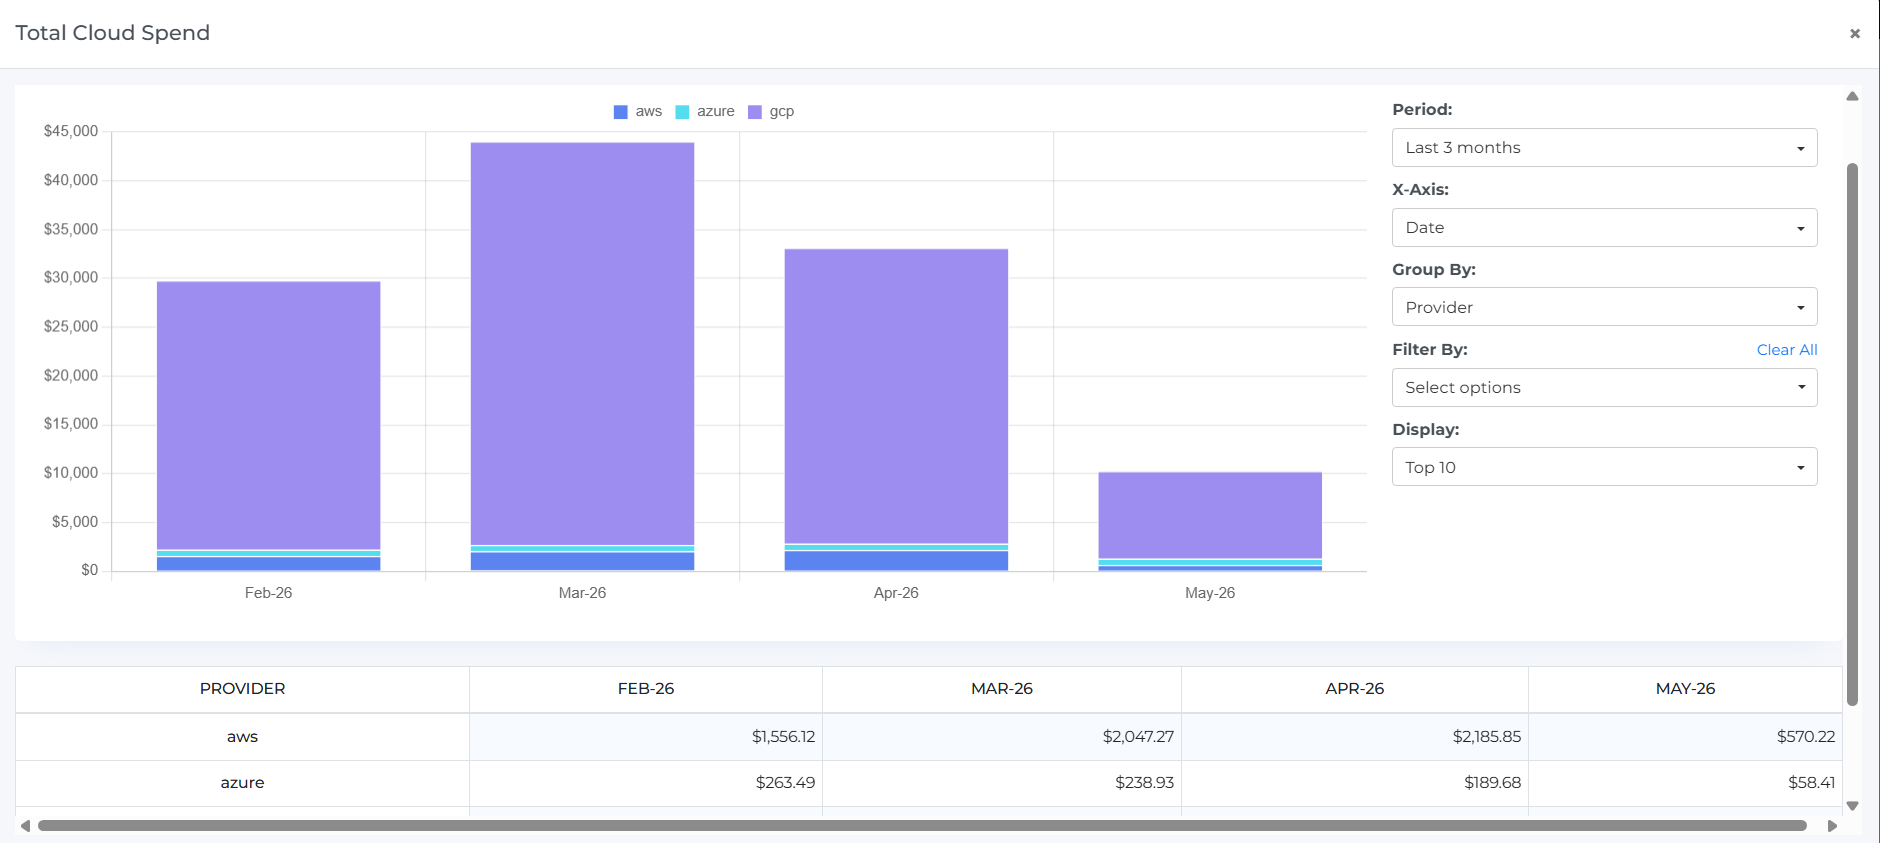
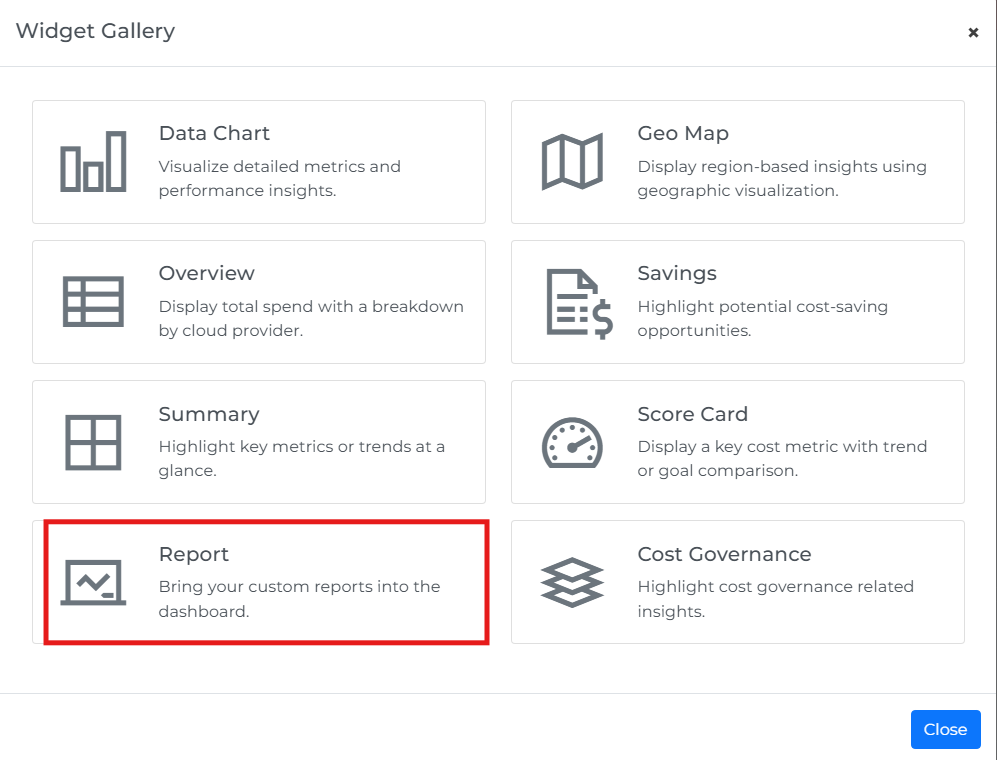
Report Widget
Bring saved reports directly into your dashboards.
A new Report widget lets you embed saved reports into any Custom Dashboard alongside other metrics. This removes the need to switch between dashboards and reports when building a consolidated view of cost and usage data.
Platform Enhancements
Unit Economics : Visibility Enhancements
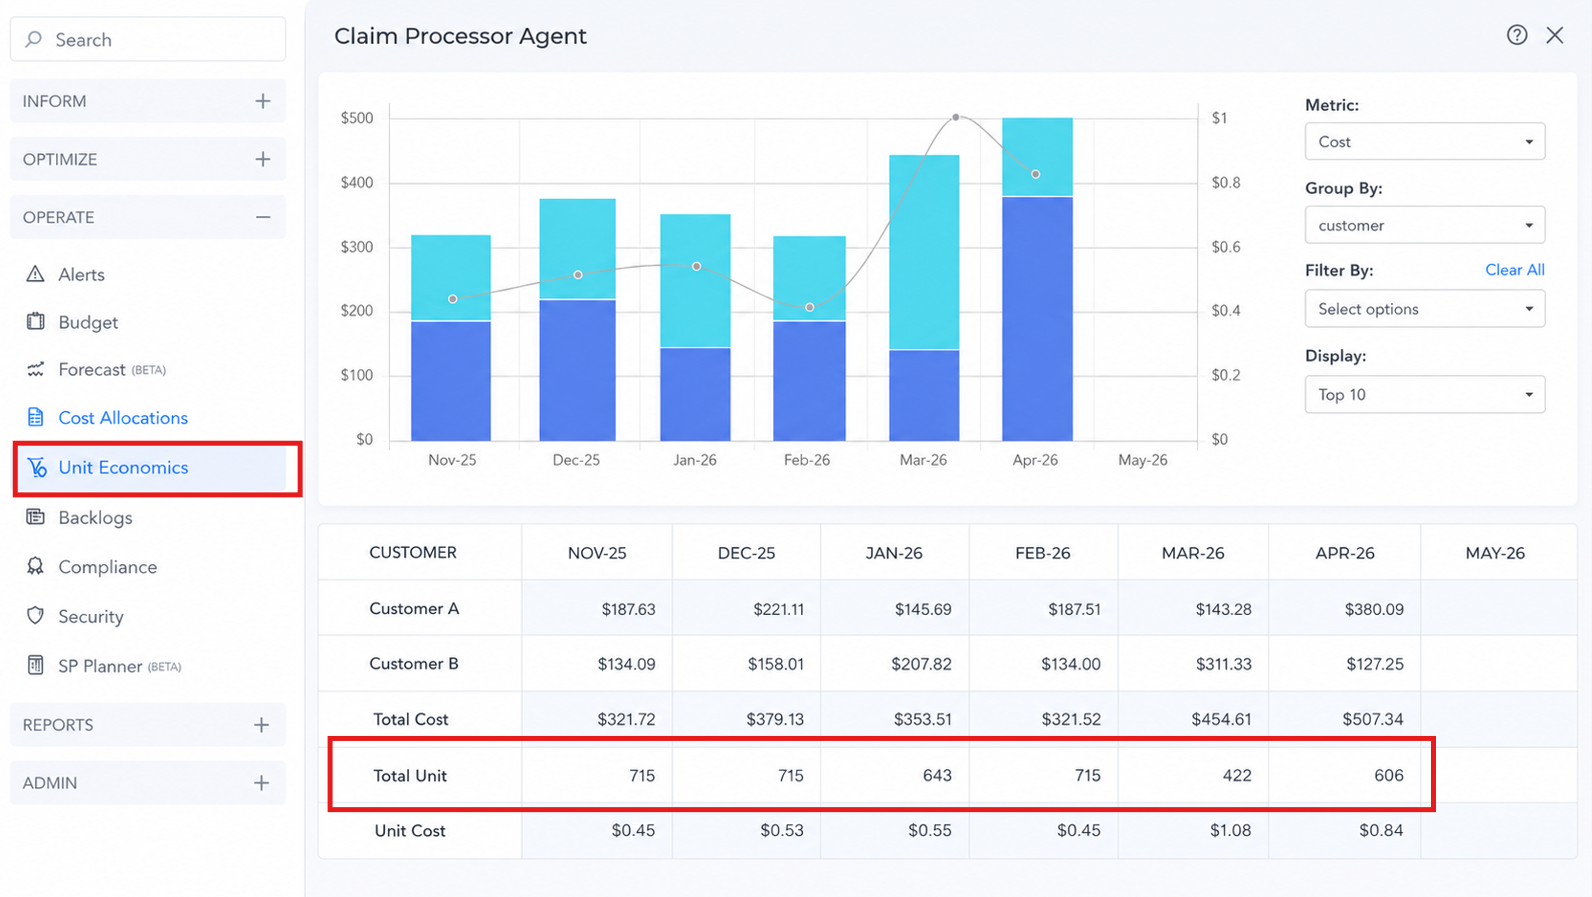
Unit Economics is now under Operate, replacing the previous Cost to Serve label - it's easier to find and more consistently named across the platform. The page now surfaces Total Units alongside Total Cost and Unit Cost in a single view, so you can see what's driving unit cost changes without reconstructing the calculation yourself.
Ticketing & Backlog : Enhancements
Ticketing emails from Mavvrik have been refreshed with improved formatting and a cleaner look and feel, making notifications easier to read and more consistent with the platform experience.
The Backlog page also displays Created By, giving teams better visibility into who opened each ticket.
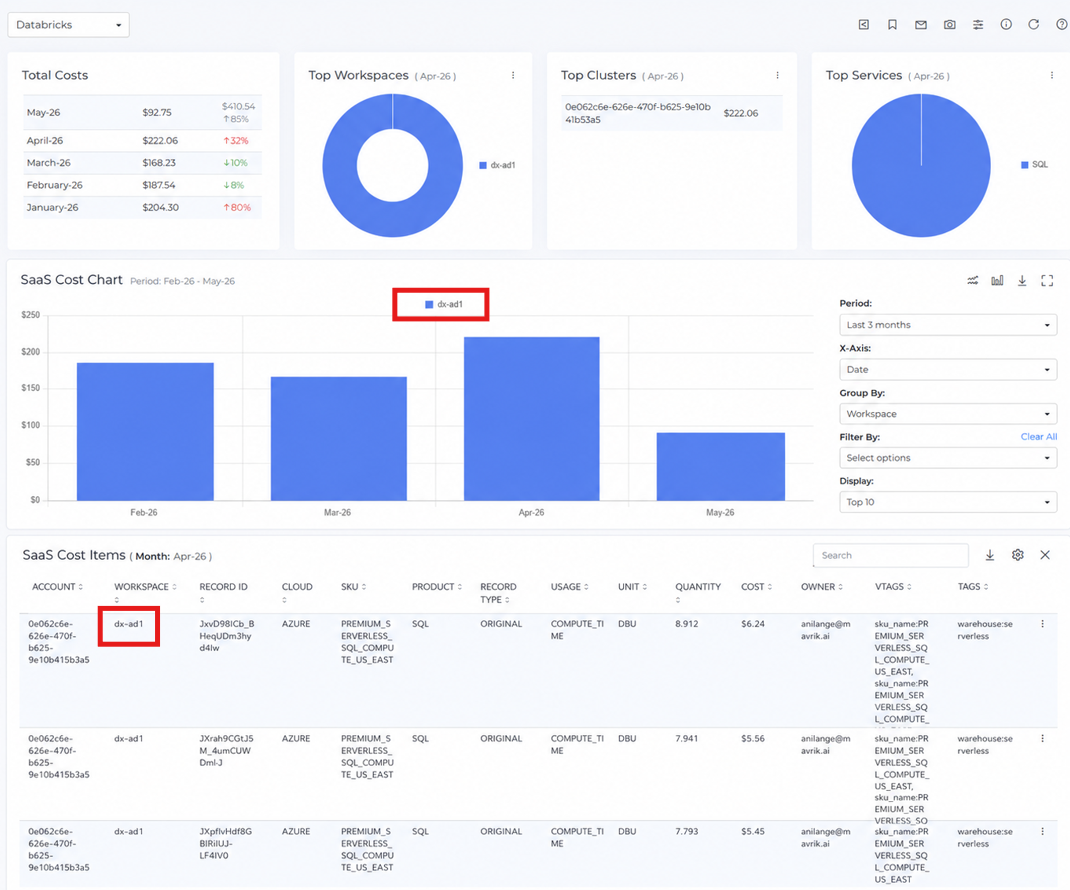
Databricks : Workspace Name Visibility
Workspace names can be surfaced in the Databricks dashboard, making it easier to identify and analyze Databricks usage by workspace instead of relying only on IDs.