.png)
Why this matters: this is the self-managed path — you're deploying Mavvrik's own appliance into your cluster via Helm, which scrapes Prometheus metrics directly rather than relying on a cloud provider's managed telemetry. Getting the Prometheus URL and script execution right here is what determines whether node and workload cost data starts flowing.
Before you start: you'll need kubectl and helm installed and configured with access to your cluster, and Prometheus already running in it.
Configuration steps
Step-1: Log in to Kubernetes Shell.
-
Ensure that kubectl and helm are installed and can access your cluster.
If Helm and kubectl are already installed, skip the steps below and proceed to Step-2.
Install kubectl
#Linux

curl -LO "https://dl.k8s.io/release/$(curl -L -s https://dl.k8s.io/release/stable.txt)/bin/linux/amd64/kubectl"

chmod +x kubectl
sudo mv kubectl /usr/local/bin/

#macOS

brew install kubectl

#Windows (PowerShell)
choco install kubernetes-cli
Install Helm
#Linux
curl https://raw.githubusercontent.com/helm/helm/main/scripts/get-helm-3 | bash

#macOS
brew install helm

#Windows
choco install kubernetes-helm
Step-2: Enter the Prometheus URL in Mavvrik
-
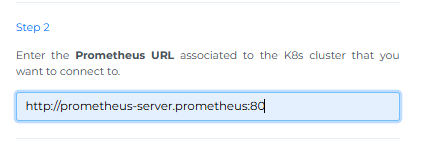
Capture the Prometheus URL associated with the K8s cluster:
a. Enter the following URL in Mavvrik UI
http://<prometheus-server-name>.<namespace>:<prometheus-internal-port>
b. To find the Prometheus service, run the following command in Kubernetes shell
kubectl get svc -n prometheus

-
In URL Replace
prometheus-server-name,namespace&prometheus-internal-portwith your data
Find & Enter the namespace where prometheus service is installed
-
Following screenshot shows the example of URL
Step 3: Execute the script from the Kubernetes Shell
-
Copy the script and execute the command below provided by Mavvrik UI within the Kubernetes Shell terminal window.
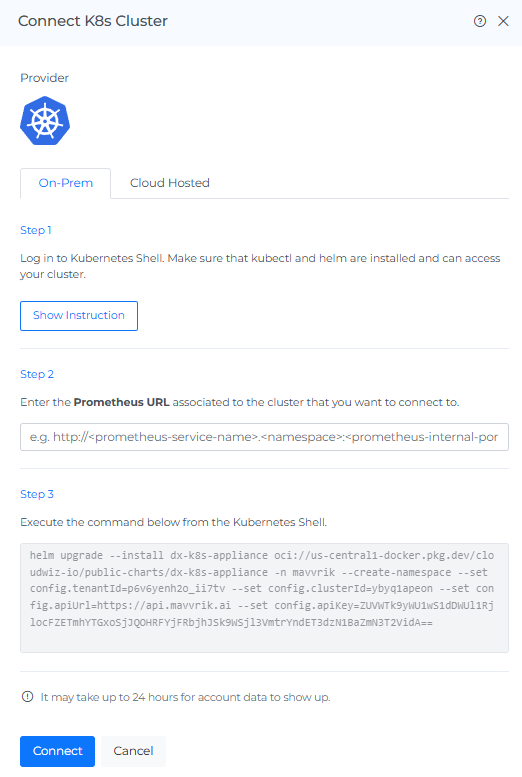
-
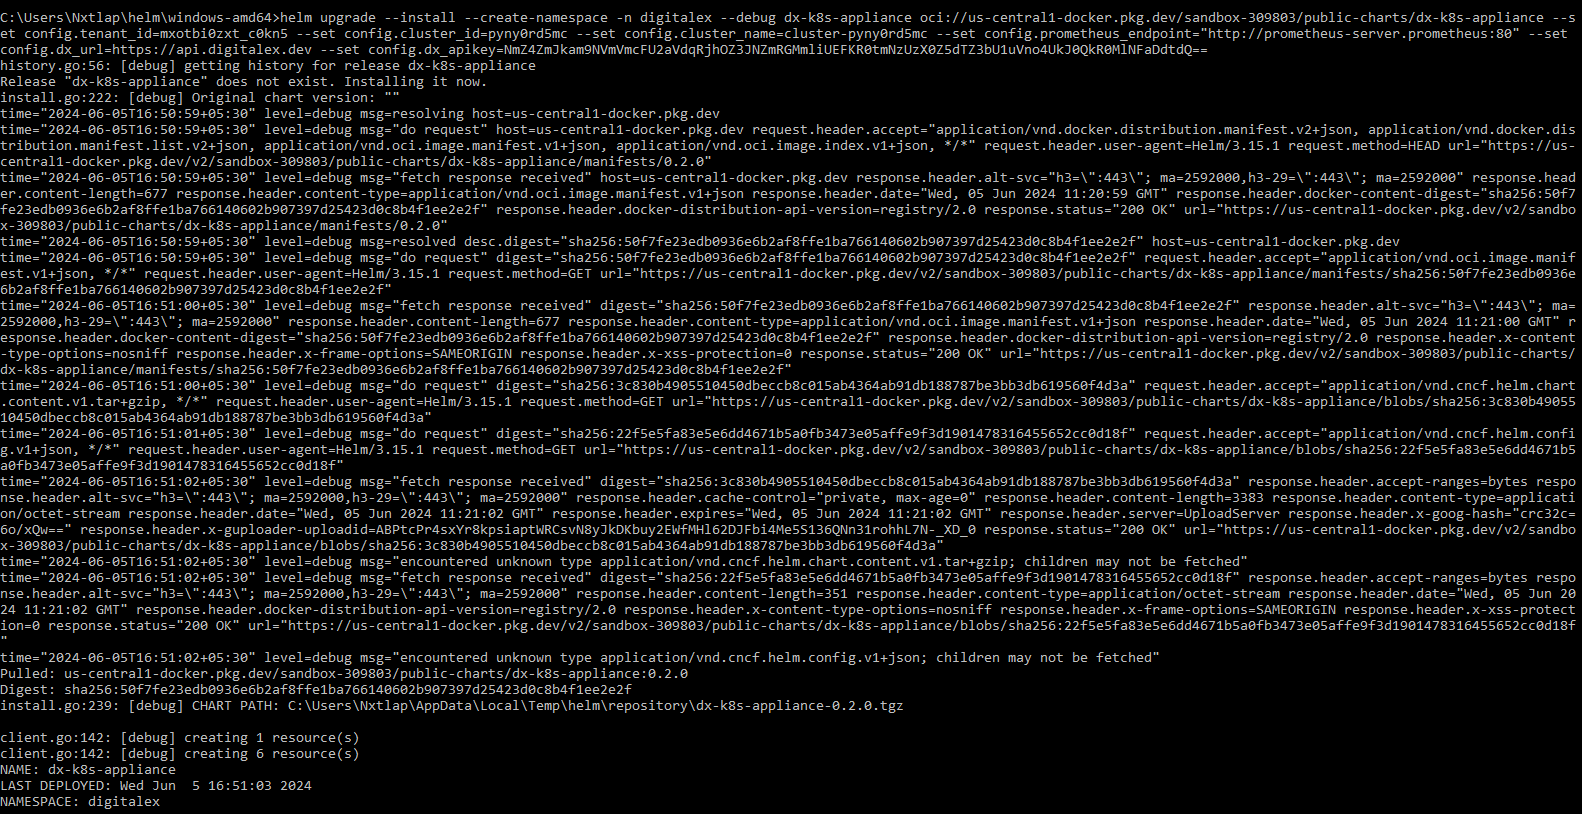
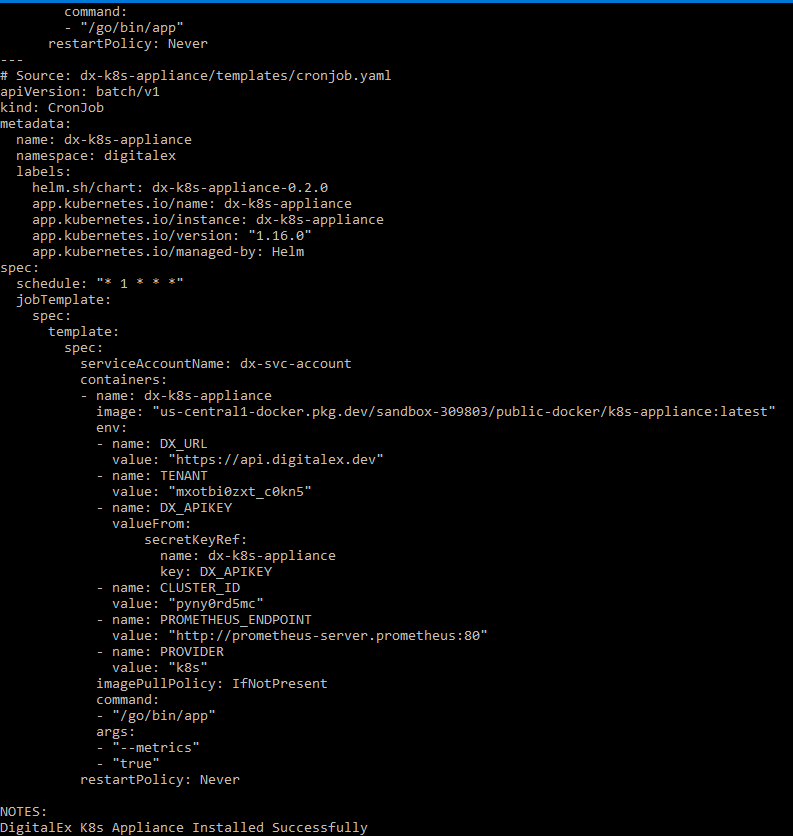
Paste in Kubernetes Shell Editor and click Enter
-
Click on the Connect button in Mavvrik, after the running script is successfully completed.
-
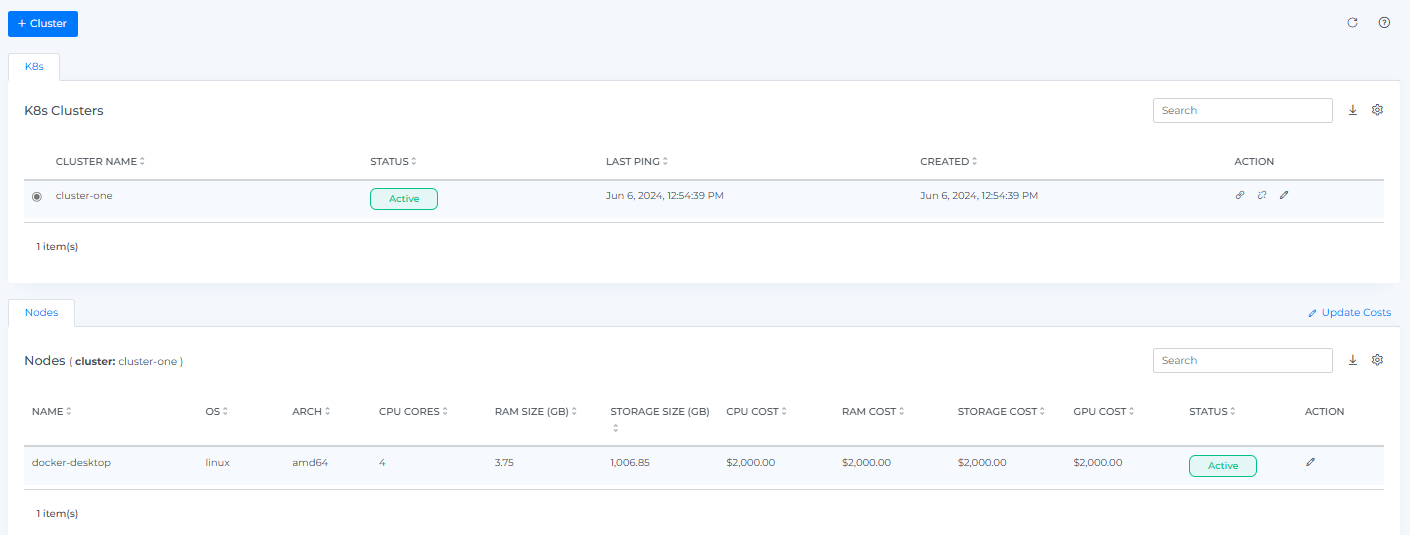
The onboarded K8s Cluster will be displayed with the list of All linked Nodes.
Troubleshooting
-
If the installation command fails, confirm that kubectl and Helm can access the intended cluster.
-
If the cluster does not connect, verify the Prometheus URL and rerun the command generated by Mavvrik.
FAQs
Do I need Prometheus already set up before starting this?
Yes — Prometheus needs to already be running in your cluster. This onboarding path scrapes metrics from your existing Prometheus, it doesn't install one for you.
How do I find the correct Prometheus URL if I don't already know it?
Run kubectl get svc -n prometheus in your Kubernetes shell to find the Prometheus service, then build the URL from the server name, namespace, and internal port shown in that output.