.png)
-
Create a Kubernetes (K8s) cluster on Azure (AKS).
-
make sure it has System & User Linux Node to provision necessary Prometheus-related pods
-
-
Install helm on the cluster.
-
connect to the k8s cluster.
-
First, we will taint the Windows node so that no Linux pods are provisioned on this node
-
kubectl taint nodes akswinbil000000 os=windows:NoSchedule -
-
-
add and update Prometheus community helm reposistory
-
helm repo add prometheus-community https://prometheus-community.github.io/helm-charts
helm repo update
-
-
Install Prometheus using Helm only on Linux nodes
-
helm install prometheus prometheus-community/prometheus \\n --namespace monitoring \\n --create-namespace \\n --set nodeSelector."kubernetes\.io/os"=linux
-
-
-
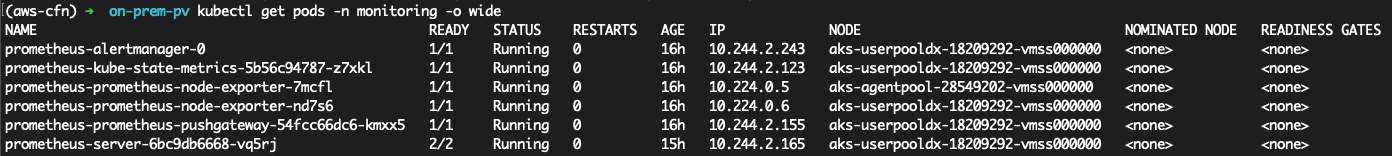
After this you will see Prometheus pods running successfully on Linux nodes only
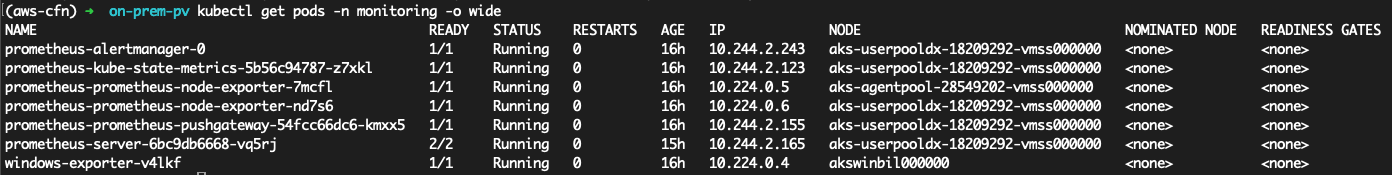
b. Install Windows Exporter on the k8s cluster to monitor Windows nodes
** This image is for Windows 2022 Datacenter: http://ghcr.io/prometheus-community/windows-exporter:0.29.0-ltsc2022
apiVersion: apps/v1
kind: DaemonSet
metadata:
  name: windows-exporter
  namespace: monitoring
spec:
  selector:
    matchLabels:
      app: windows-exporter
  template:
    metadata:
      labels:
        app: windows-exporter
    spec:
      nodeSelector:
        kubernetes.io/os: windows
      tolerations:
      - key: "os"
        operator: "Equal"
        value: "windows"
        effect: "NoSchedule"
      hostNetwork: true
      securityContext:
        windowsOptions:
          hostProcess: true
          runAsUserName: "NT AUTHORITY\\System"
      containers:
      - name: windows-exporter
        image: ghcr.io/prometheus-community/windows-exporter:0.29.0-ltsc2022
        ports:
        - containerPort: 9182
          hostPort: 9182
          name: http
        args:
        - --collectors.enabled=cpu,cs,container,logical_disk,memory,net,os
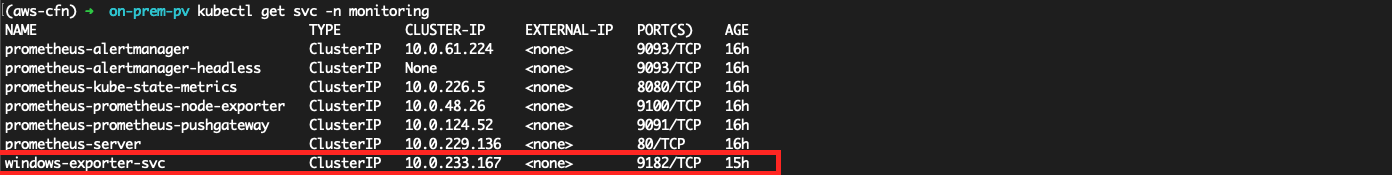
c. Install windows-exporter service
apiVersion: v1
kind: Service
metadata:
  name: windows-exporter-svc
  namespace: monitoring
spec:
  selector:
    app: windows-exporter  # Must match labels in your DaemonSet pods
  ports:
    - name: http
      port: 9182
      targetPort: 9182
  type: ClusterIP
c. Update the Prometheus config map to scrape Windows-exporter metrics. Under the scrape config, add the following configuration.
    scrape_configs:
    - job_name: 'windows_node'
      static_configs:
      - targets:
        - 'windows-exporter-svc.monitoring.svc.cluster.local:9182'
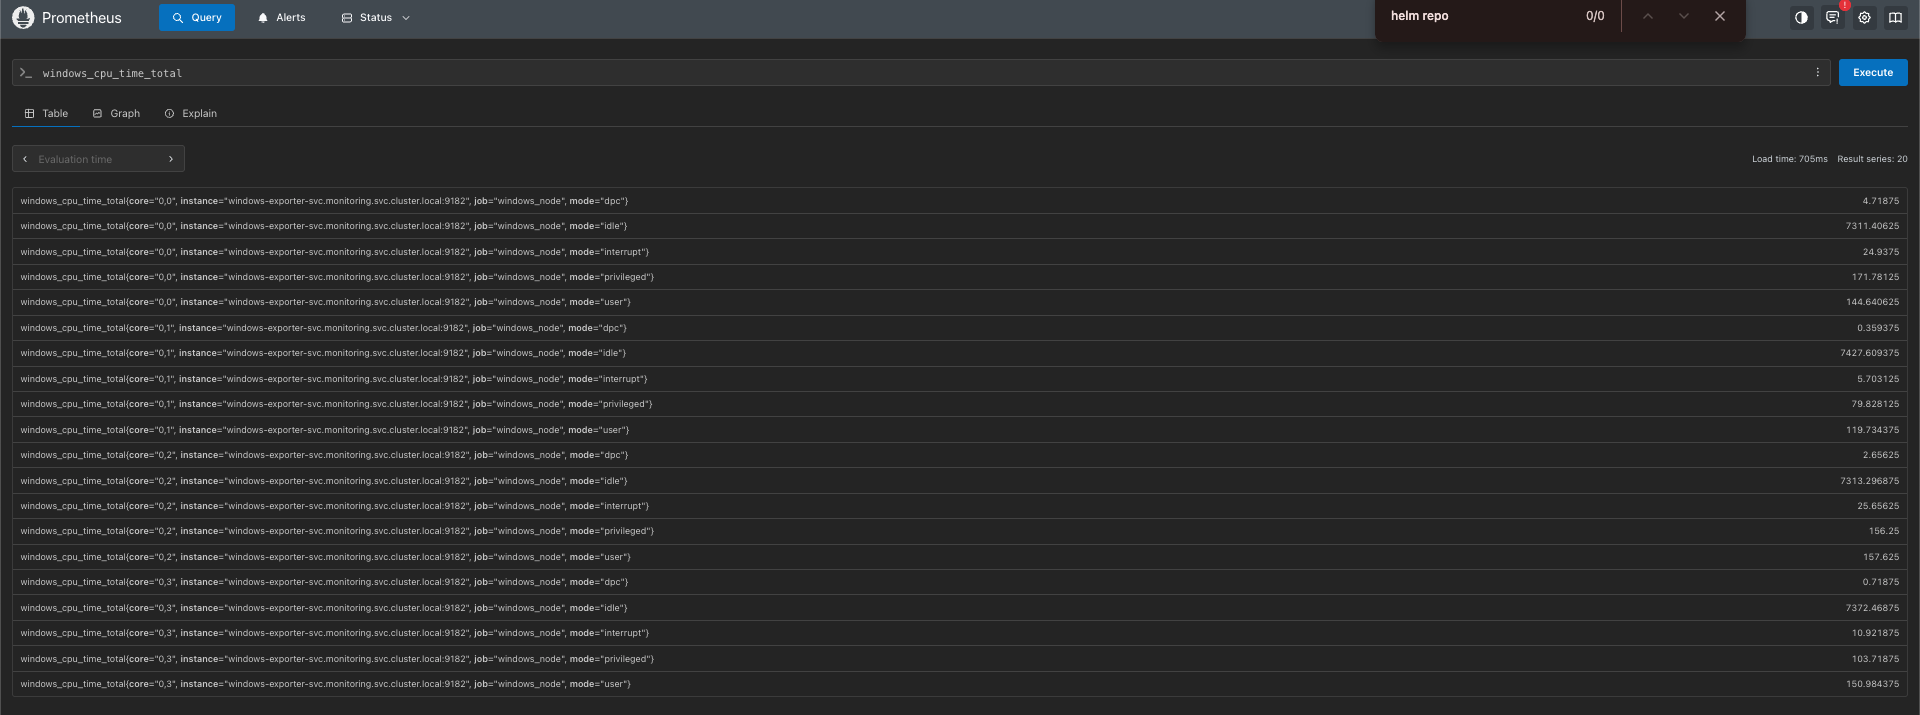
Access the Prometheus UI to see Windows metrics like: