
CSV Connector Cost Overview
This dashboard provides a clear view of the SaaS costs you bring into Mavvrik through the CSV connector. Use it to track spending trends, find the accounts, products and locations that drive cost, and review the underlying line items for any month.
To open this dashboard, click on the Menu icon, then INFORM, then SaaS Cost. Use the provider drop-down at the top left of the page and choose the name of your CSV connector provider (the other options are All, the built-in SaaS providers and any other custom providers you have connected).
The dashboard shows the data you upload through the CSV connector. Columns that are empty in your CSV file appear blank in the dashboard, and dimensions that your file does not use have no values to group or filter by.
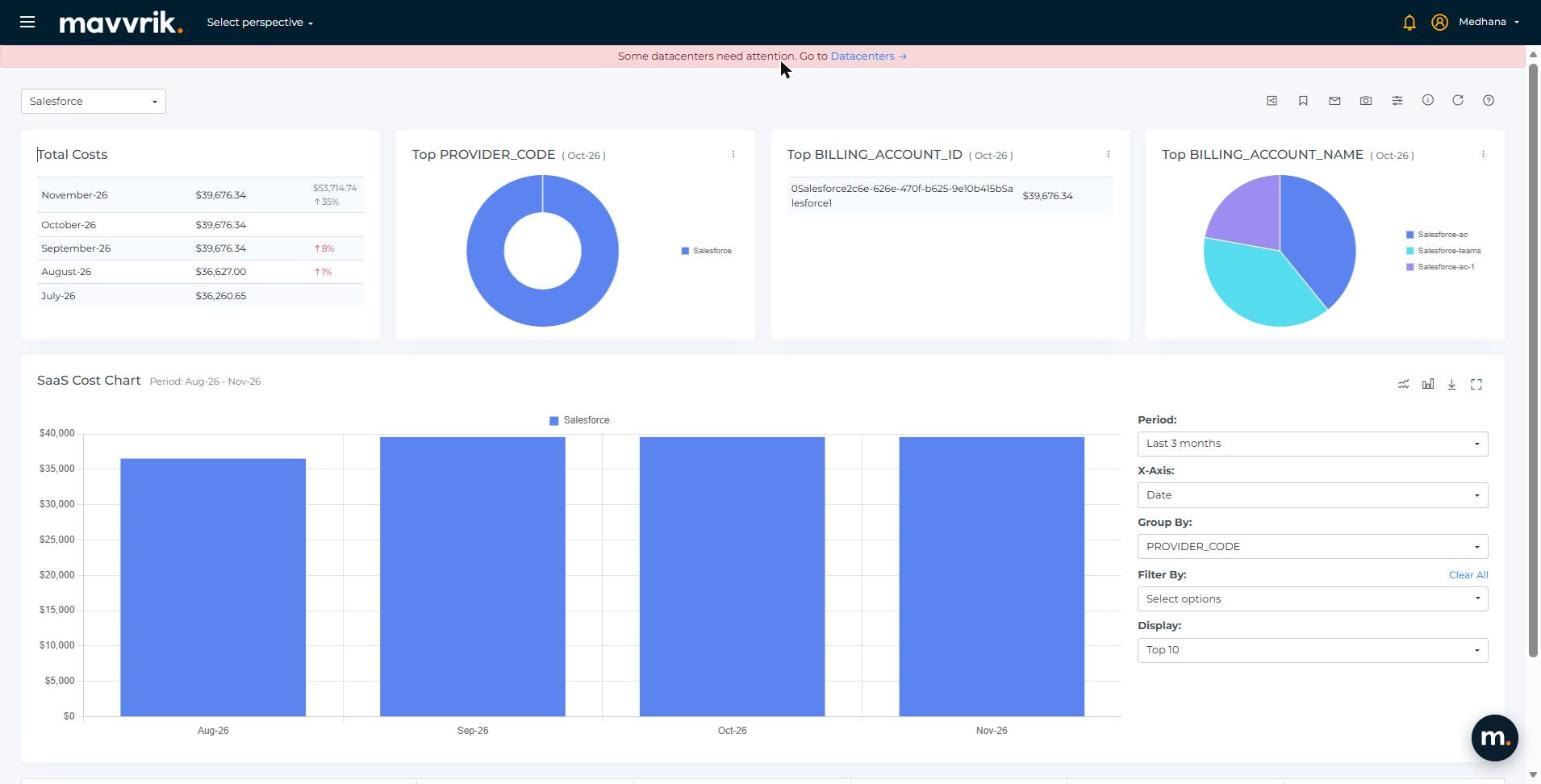
Total Costs
Displays the total cost of the selected CSV provider across recent months.
-
Monthly Breakdown: Lists monthly costs, with the current month first.
-
Percentage Indicators: Shows month-over-month change (with arrow and % change if applicable).
-
Forecasting: The current month shows a forecast value next to its cost.
Top Widgets
Three widgets summarize the highest-cost items for the selected month. By default they show:
-
Top PROVIDER_CODE: Donut chart of cost per provider.
-
Top BILLING_ACCOUNT_ID: Table listing the billing accounts with the most spend.
-
Top BILLING_ACCOUNT_NAME: Pie chart of cost per billing account name.
Hover over a chart to see the exact spend. Use these widgets to quickly spot the biggest cost contributors.
Widget Builder
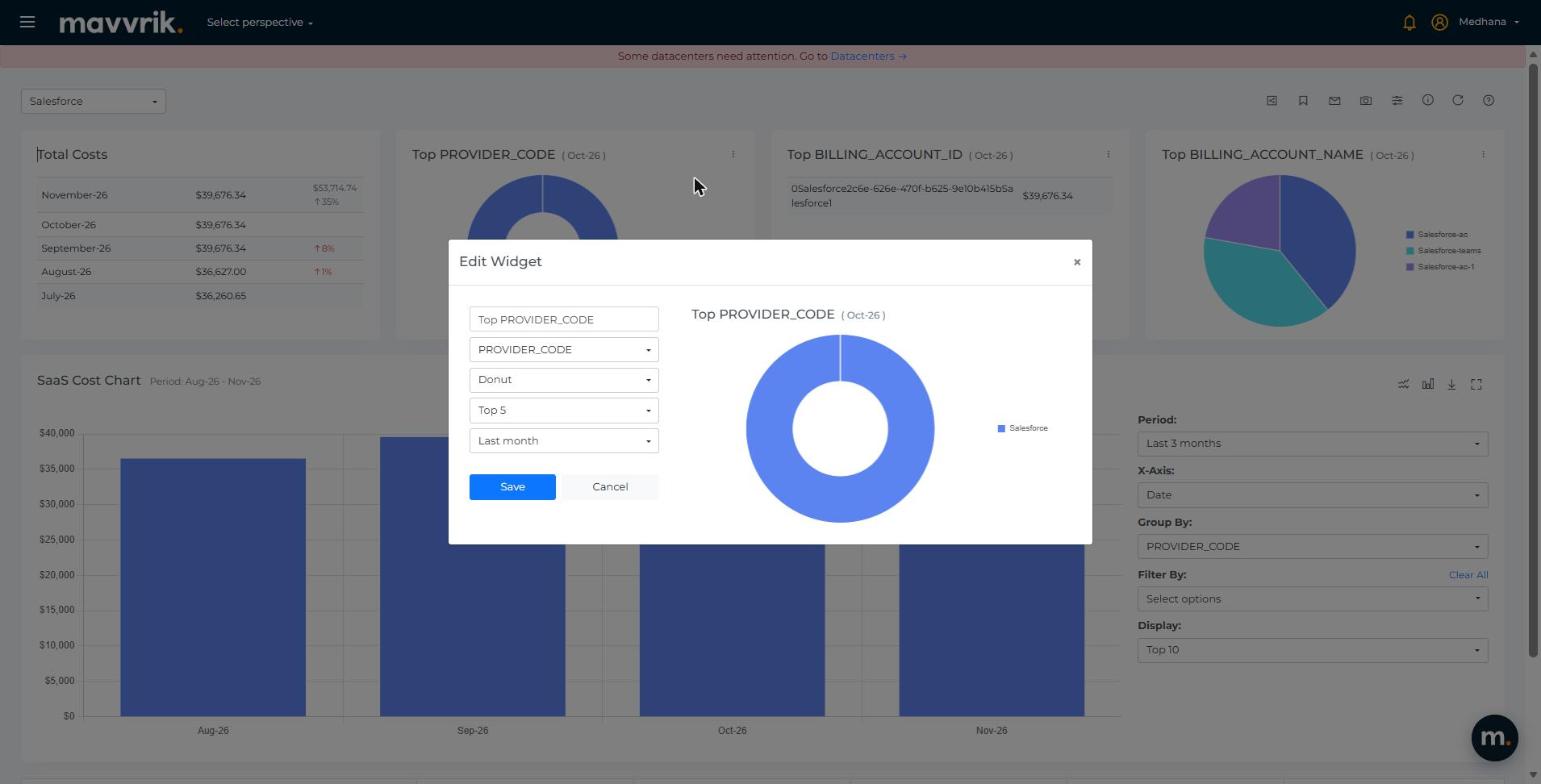
Each top widget has a Customize icon (three dots) with Edit and Restore options. Edit opens the Edit Widget dialog, where you can change:
-
The widget name.
-
The dimension: PROVIDER_CODE, BILLING_ACCOUNT_ID, BILLING_ACCOUNT_NAME, USAGE_ACCOUNT_ID, USAGE_ACCOUNT_NAME, LOCATION_ID, LOCATION_NAME, SKU_ID, SKU_NAME, PRODUCT_NAME, PROVIDER_CURRENCY, UNIT_OF_QUANTITY or Virtual Tag.
-
The chart type (for example Table, Donut, Pie or bar charts).
-
The number of items to show (starting at Top 5).
-
The period (for example Last month).
A live preview appears on the right. Click on Save to apply the changes or Cancel to close the dialog. Restore returns the widget to its default configuration.
SaaS Cost Chart
Visualizes the cost of your CSV provider over time. Use the controls on the right side of the chart to change what it shows.
-
Period: Last 1 month, Last 3 months, Last 6 months, Last 12 months or Custom months.
-
X-Axis: Date (the default), INVOICE_MONTH, USAGE_DATE, or any dimension such as PROVIDER_CODE, BILLING_ACCOUNT_NAME, USAGE_ACCOUNT_NAME, LOCATION_NAME, SKU_NAME, PRODUCT_NAME, PROVIDER_CURRENCY, COST_TYPE or UNIT_OF_QUANTITY.
-
Group By: Split the cost by PROVIDER_CODE (the default), BILLING_ACCOUNT_ID, BILLING_ACCOUNT_NAME, USAGE_ACCOUNT_ID, USAGE_ACCOUNT_NAME, LOCATION_ID, LOCATION_NAME, SKU_ID, SKU_NAME, PRODUCT_NAME, PROVIDER_CURRENCY, COST_TYPE, UNIT_OF_QUANTITY or Virtual Tag.
-
Filter By: Limit the chart to specific values of a dimension. Click on Clear All to remove the filters.
-
Display: Top 10, Top 20, Top 30, Top 50 or Top 100, to limit the number of series shown.
-
Chart Type: Vertical Bar (stacked), Horizontal Bar (stacked), Vertical Bar, Horizontal Bar, Line or Line (fill).
-
Interactivity: Hover over a bar to see the cost, and click on a bar to open the Cost Items for that month.
-
Download CSV: Exports the chart data to a CSV file.
-
Full-Chart View: Expands the chart.
The table below the chart lists the same data by month with a TOTAL row and column. Click on a column heading to sort.
Filters
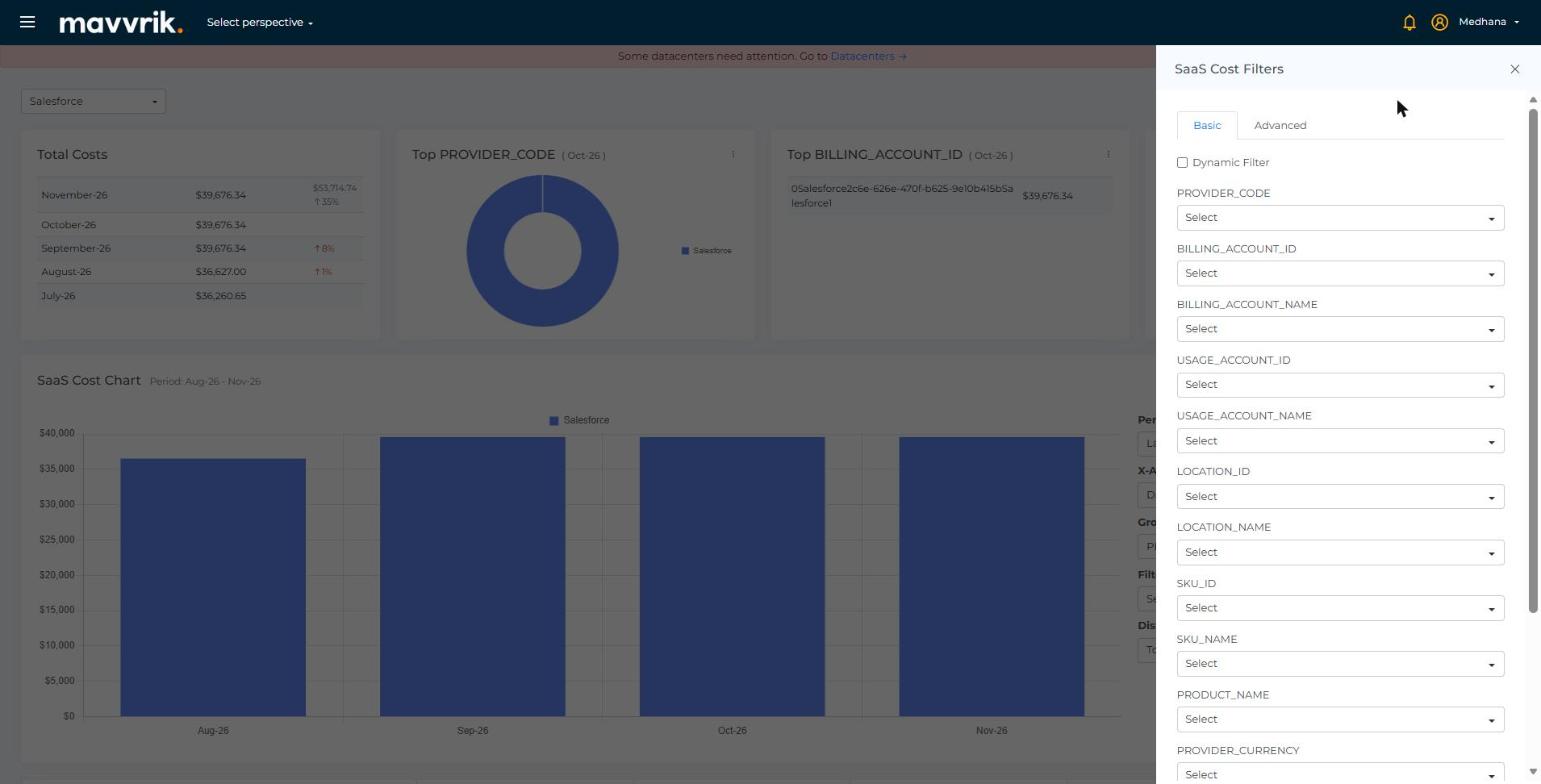
The Filters icon in the page header opens the SaaS Cost Filters panel, which applies to the whole page.
-
Basic tab: Select values for PROVIDER_CODE, BILLING_ACCOUNT_ID, BILLING_ACCOUNT_NAME, USAGE_ACCOUNT_ID, USAGE_ACCOUNT_NAME, LOCATION_ID, LOCATION_NAME, SKU_ID, SKU_NAME, PRODUCT_NAME, PROVIDER_CURRENCY, COST_TYPE and UNIT_OF_QUANTITY. Tick Dynamic Filter to keep the filter in step with your data.
-
Advanced tab: Build filters with + Filter and Group, choosing the dimension, an operator (for example In) and the values.
Click on Apply to filter the page, Cancel to close the panel, or Clear All to remove every filter.
Cost Items
Click on a bar in the SaaS Cost Chart to open the SaaS Cost Items table for that month and provider. It lists every line item behind the number, so you can verify the totals.
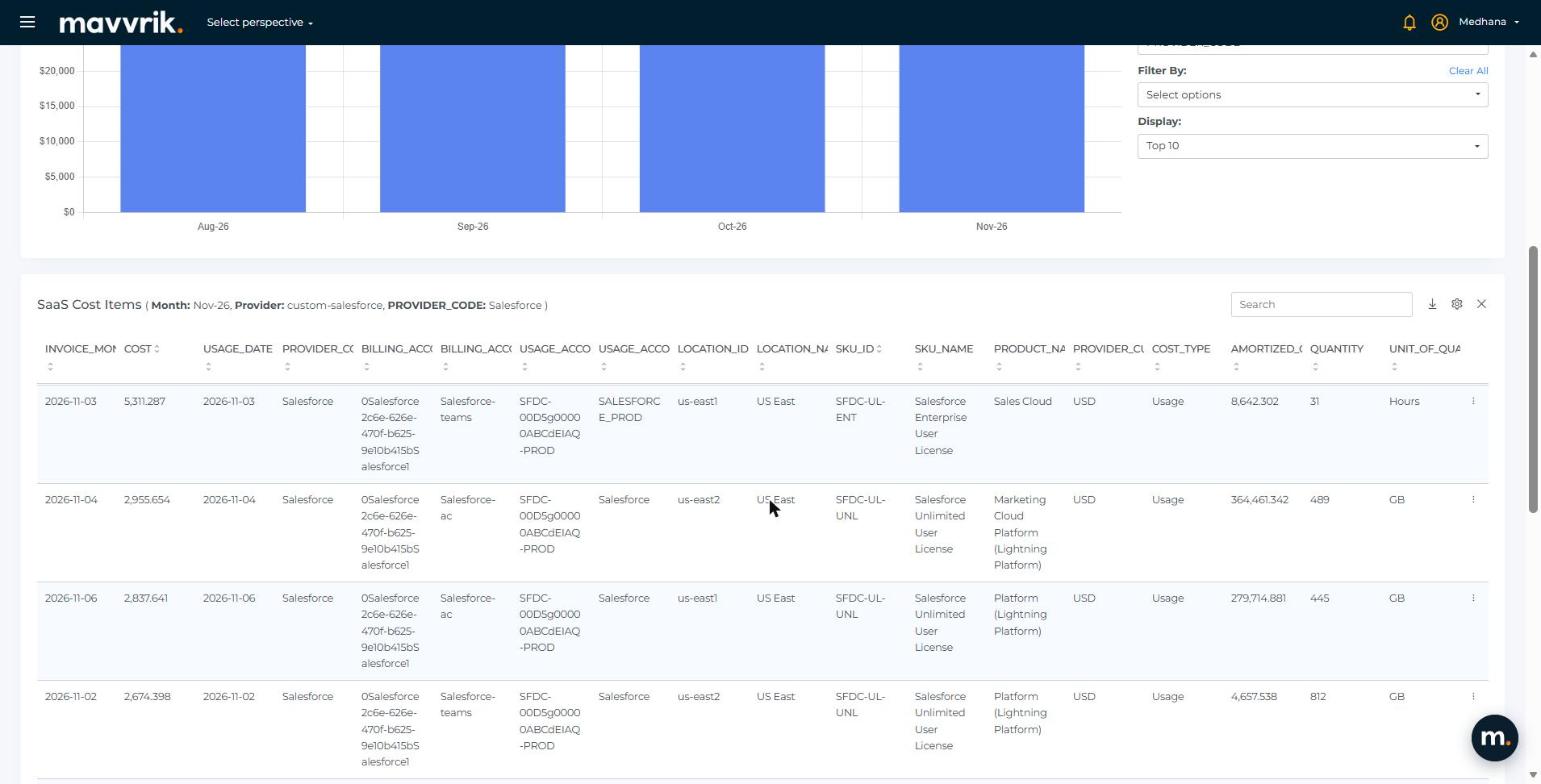
The table shows these columns:
|
Column |
Description |
|---|---|
|
INVOICE_MONTH |
Invoice month the line item belongs to. |
|
COST |
Cost of the line item. |
|
USAGE_DATE |
Date the usage occurred. |
|
PROVIDER_CODE |
Name of the CSV provider. |
|
BILLING_ACCOUNT_ID / BILLING_ACCOUNT_NAME |
Account that is billed for the cost. |
|
USAGE_ACCOUNT_ID / USAGE_ACCOUNT_NAME |
Account that used the service. |
|
LOCATION_ID / LOCATION_NAME |
Region or location of the usage. |
|
SKU_ID / SKU_NAME |
Item that was purchased or used. |
|
PRODUCT_NAME |
Product the item belongs to. |
|
PROVIDER_CURRENCY |
Currency of the cost in your file. |
|
COST_TYPE |
Type of charge, for example Usage or Regular. |
|
AMORTIZED_COST |
Cost spread across the period it covers. |
|
QUANTITY / UNIT_OF_QUANTITY |
Amount used and its unit, for example Hours or GB. |
Use the search box to find a line item, change the number of rows per page at the bottom of the table, and use the Download CSV icon to export the items. The Close icon hides the table.
Header Tools
-
Share: Copy the link with filters applied.
-
Bookmark: Save the current view, including filters, to revisit later from your profile menu.
-
Subscription: Set up a recurring email report of this page; see the Subscriptions page for setup steps.
-
Screenshot: Capture a PDF view of the dashboard.
-
Filters: Opens the SaaS Cost Filters panel.
-
Info: Shows the last update timestamp, so you can confirm data freshness.
-
Reload: Reload with the latest available data.
-
Help: Access documentation.
FAQs
Why are some columns blank in the Cost Items table?
The dashboard shows what is in your CSV file. If a column such as LOCATION_NAME or SKU_NAME is empty in the file, it is blank in the dashboard.
Why does the current month show a forecast?
Mavvrik projects the current month's cost from the usage so far, so you can see the expected total before the month ends.
How do I see the line items behind a monthly total?
Click on the bar for that month in the SaaS Cost Chart. The SaaS Cost Items table opens below the chart.
How do I see cost by account, product or location?
Change Group By in the SaaS Cost Chart, for example to BILLING_ACCOUNT_NAME, PRODUCT_NAME or LOCATION_NAME.