.png)
AWS: Steps for Self Hosted K8s on EC2
-
Edit node exporter Daemonset to add initContainer to collect instance metadata
Eg:
kubectl edit daemonset prometheus-prometheus-node-exporter -n prometheus
Sidecar calls the instance metadata API and pushes the data into the .prom file
i.e /textfile_collector/ec2_metadata.prom
      initContainers:
      - args:
        - |
          mkdir -p /textfile_collector
          METRICS_FILE="/textfile_collector/ec2_instance_metadata.prom"
          # Fetch IMDSv2 Token
           TOKEN=$(curl -s -X PUT "http://169.254.169.254/latest/api/token" -H "X-aws-ec2-metadata-token-ttl-seconds: 21600")
          fetch() {
            curl -s -H "X-aws-ec2-metadata-token: $TOKEN" "http://169.254.169.254/latest/meta-data/$1"
          }
          # Fetch EC2 Metadata using the token
          INSTANCE_ID=$(fetch instance-id)
          INSTANCE_TYPE=$(fetch instance-type)
          AVAILABILITY_ZONE=$(fetch placement/availability-zone)
          REGION=$(echo "$AVAILABILITY_ZONE" | sed 's/.$//')
          LOCAL_HOSTNAME=$(fetch local-hostname)
          PUBLIC_HOSTNAME=$(fetch public-hostname)
          PUBLIC_IPV4=$(fetch public-ipv4)
          RESERVATION_ID=$(fetch reservation-id)
          AZ_ID=$(fetch placement/availability-zone-id)
          # PLACEMENT_GROUP=$(fetch placement/group-name)
          # HOST_ID=$(fetch placement/host-id)
          HOSTNAME=$(fetch hostname)
          esc() {
            echo "$1" | sed 's/\\\\/\\\\\\\\/g; s/\"/\\\\\"/g'
          }
          # Write to Prometheus Textfile Collector
          cat <<EOF > $METRICS_FILE
          ec2_instance_metadata{instance_id="$(esc "$INSTANCE_ID")",instance_type="$(esc "$INSTANCE_TYPE")",region="$(esc "$REGION")",az="$(esc "$AVAILABILITY_ZONE")",az_id="$(esc "$AZ_ID")",hostname="$(esc "$HOSTNAME")",local_hostname="$(esc "$LOCAL_HOSTNAME")",public_hostname="$(esc "$PUBLIC_HOSTNAME")",public_ipv4="$(esc "$PUBLIC_IPV4")",reservation_id="$(esc "$RESERVATION_ID")"} 1
          EOF
        command:
        - /bin/sh
        - -c
        image: alpine/curl:latest
        imagePullPolicy: Always
        name: fetch-ec2-metadata
        volumeMounts:
        - mountPath: /textfile_collector
          name: textfile-collector
and volume to store the file under volumes section.
      volumes:
      - hostPath:
          path: /var/lib/node_exporter/textfile_collector
          type: DirectoryOrCreate
        name: textfile-collector
The Node Exporter reads the metrics file and exposes the data as metrics, which Prometheus then scrapes (pulls) during its scheduled intervals.
      containers:
        - name: node-exporter
          image: quay.io/prometheus/node-exporter:latest
          args:
            - "--collector.textfile.directory=/textfile_collector"
-
Delete the prometheus pod to start the scrapping immediately
kubectl delete pod prometheus-server-cff59876f-8qfs4 -n prometheus
Verification Steps:
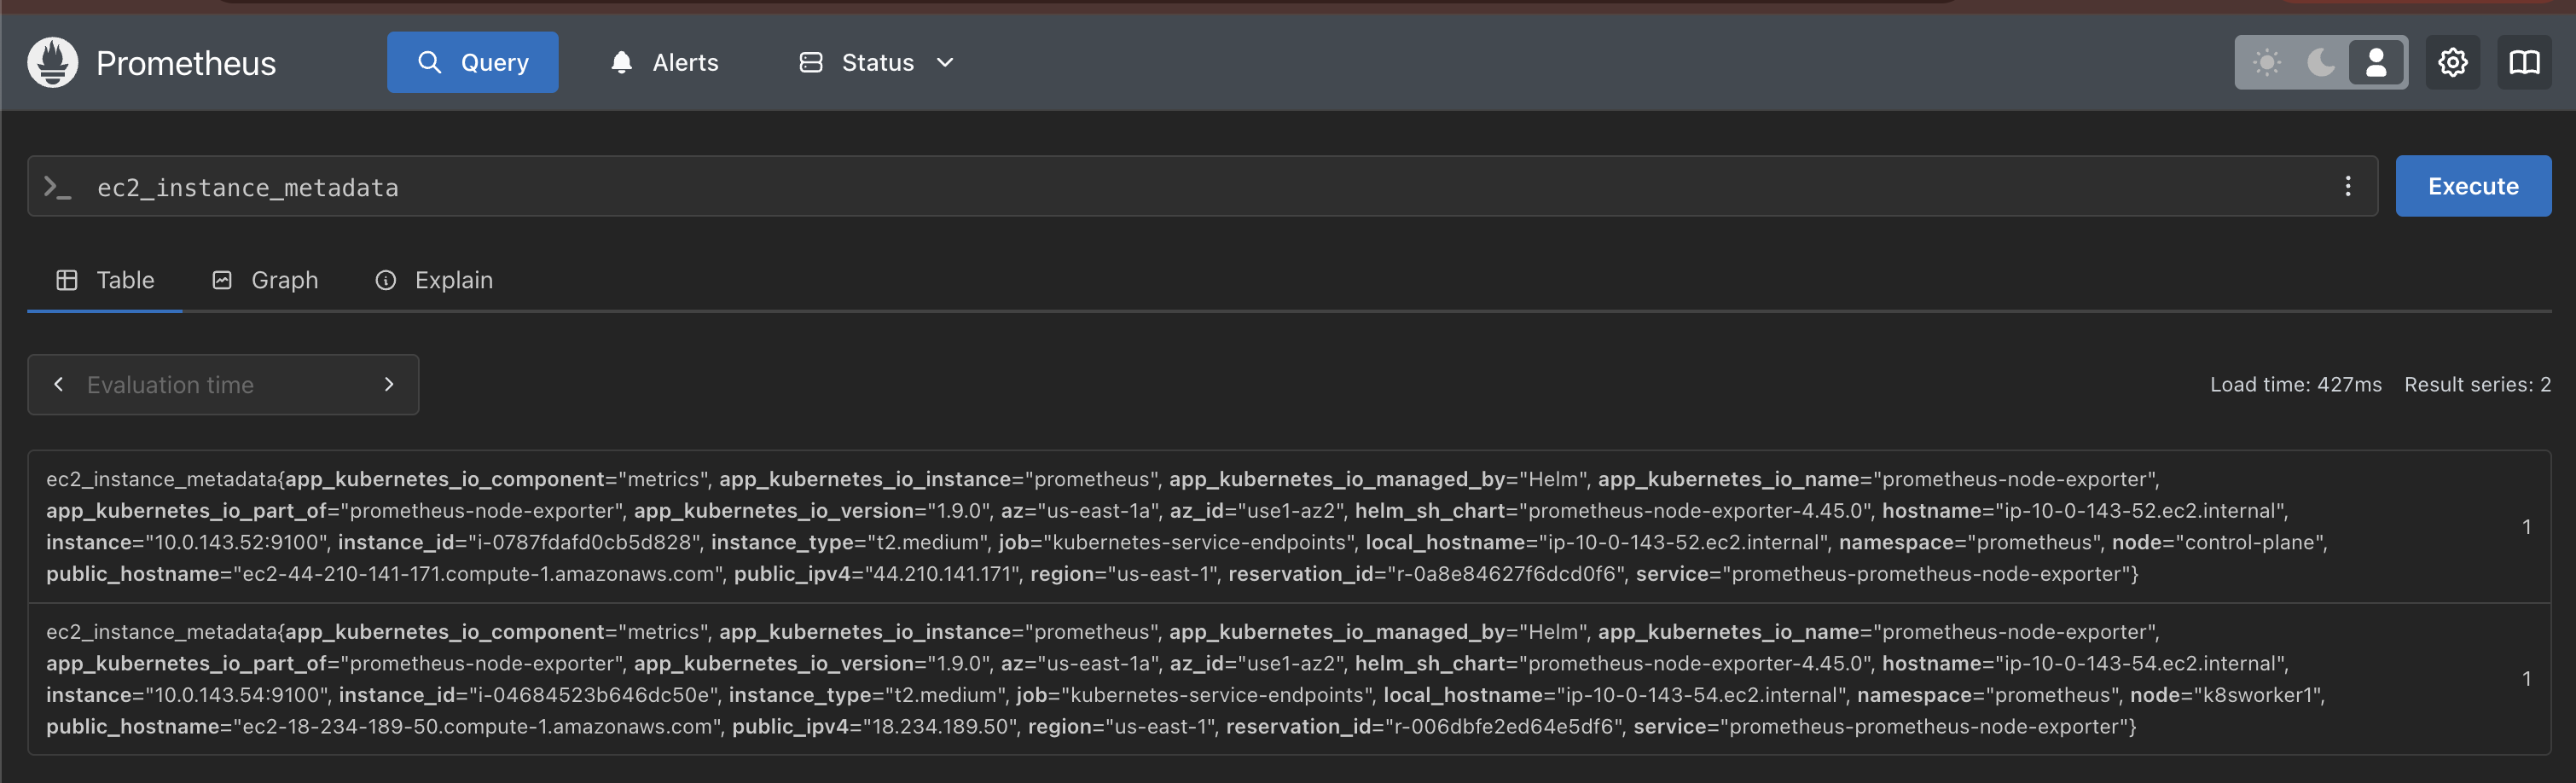
verify if Prometheus has ec2_instance_metadata upon querying
http://{prometheus_url}/api/v1/query?query=ec2_instance_metadata
Troubleshooting
The ec2_instance_metadata metric is missing from Prometheus
-
Check that the metadata init container was added to the intended Node Exporter DaemonSet and that it produced the metrics file.
-
Compare the file location used by the init container with the Node Exporter --collector.textfile.directory setting. Both must refer to the intended textfile-collector directory.
-
Check that the shared volume makes the generated file available to Node Exporter, rather than only to the init container.
-
Use the Prometheus query shown in Verification Steps to check for ec2_instance_metadata. If it is still absent, review the metadata collection and Node Exporter scraping configuration before changing unrelated workloads.