.png)
The K8s Efficiency page shows how well your Kubernetes clusters are using the compute resources they've requested — helping you spot over-provisioned pods, tune requests, and cut waste across every cluster you're onboarded.
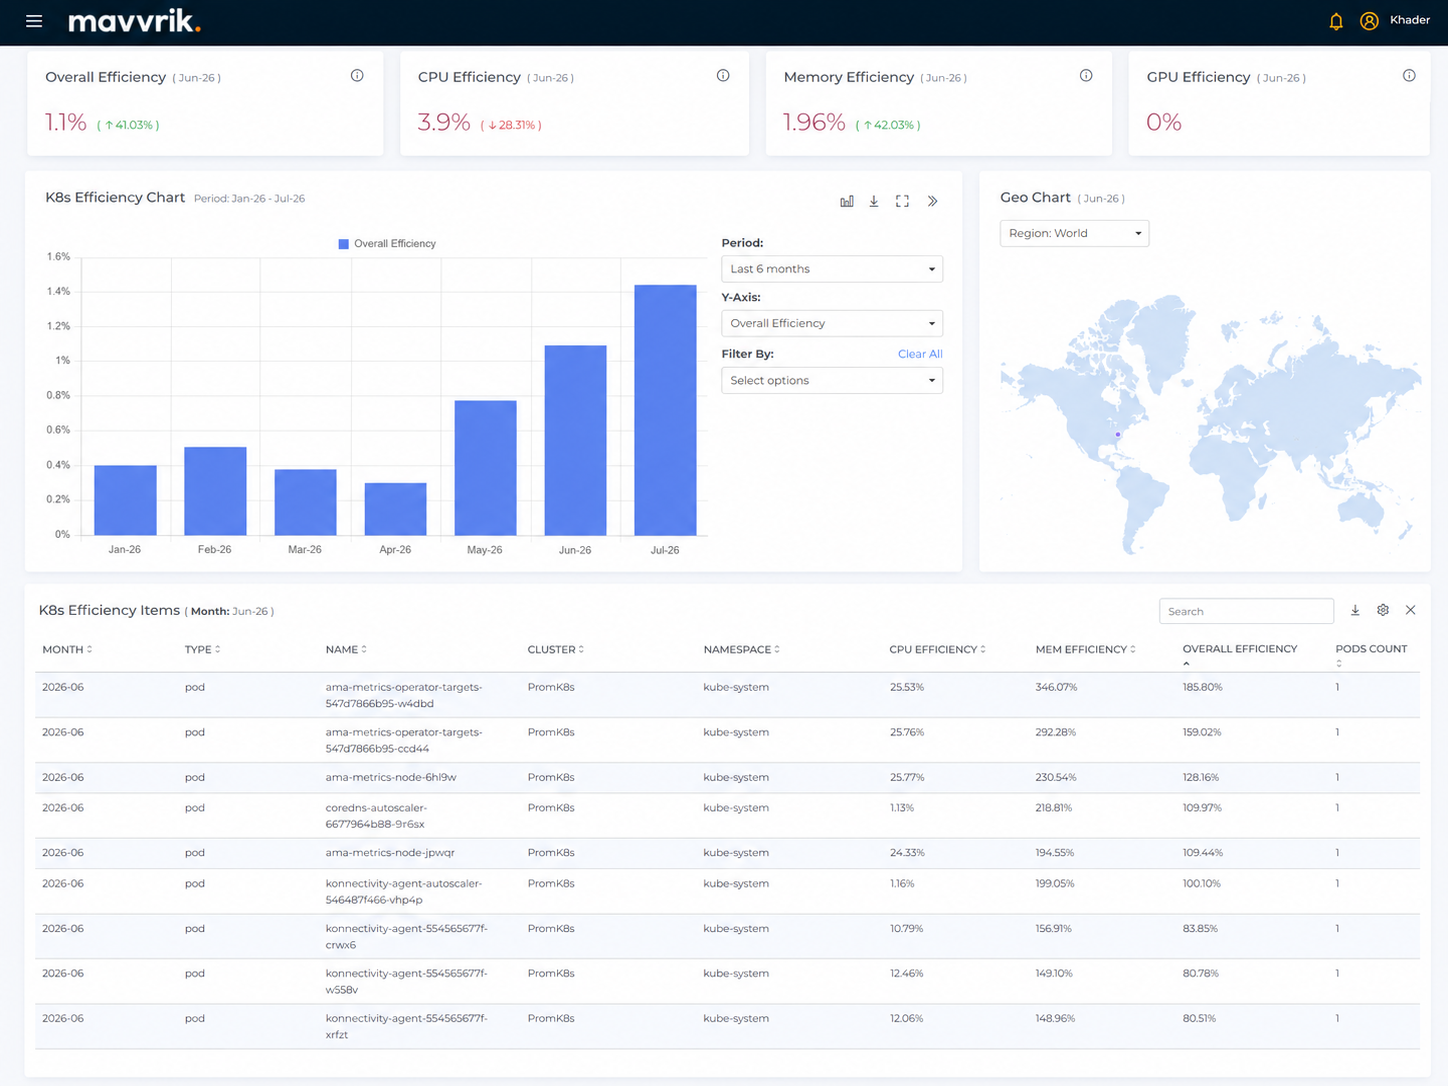
Why this matters: a cluster's total cost tells you what you spent, but not whether it was spent well — a pod requesting 4 CPUs while only using 0.5 is paying for capacity it never touches. Efficiency is what turns "this cluster costs $X" into "this specific workload is over-provisioned by this much," which is what actually makes right-sizing possible.
Efficiency summary cards
Four cards at the top give you a quick read on the current month, each compared against the previous month:
-
Overall Efficiency — average overall efficiency across all clusters.
-
CPU Efficiency — average CPU usage relative to CPU requested, across all clusters.
-
Memory Efficiency — average memory usage relative to memory requested, across all clusters.
-
GPU Efficiency — average GPU usage relative to GPU capacity, across all clusters.
Click the ⓘ icon on any card to see its definition without leaving the page.
K8s Efficiency Calculations
Every efficiency percentage on this page — pod, namespace, cluster, and the summary cards — comes from the same formula.
Efficiency % = Usage ÷ Denominator × 100
Usage is real consumption measured from the cluster. Denominator is the booked resource that was paid for, resolved in a fixed order:
|
Condition |
Denominator used |
|---|---|
|
Request is defined |
Request |
|
Request not defined, limit is defined |
Limit |
|
Neither request nor limit is defined |
Node allocatable capacity |
|
GPU — always, regardless of request or limit |
GPU capacity |
A container with no request and no limit is measured against the whole node's capacity, so its efficiency reads as very low. This is expected — nothing was reserved for it.
Units used for each resource
|
Resource |
Unit |
What is measured |
|---|---|---|
|
🔧 CPU |
Cores |
CPU cores consumed, against cores booked |
|
🧠 Memory |
Bytes |
Working-set memory consumed, against memory booked |
|
🖥️ GPU |
Megabytes (MB) of GPU memory |
GPU framebuffer memory in use, against the GPU's total memory |
|
GPU allocation |
Denominator |
|---|---|
|
Whole GPU |
The device's full memory capacity — for example, roughly 81,000 MB on an 80 GB card |
|
MIG slice |
The slice's own memory capacity, not the physical card's — a |
Worked examples
|
Resource |
Booked |
Used |
Efficiency |
|---|---|---|---|
|
🔧 CPU |
2 vCPU requested |
0.5 vCPU |
0.5 ÷ 2 × 100 = 25% |
|
🔧 CPU |
4 vCPU limit, no request |
1 vCPU |
1 ÷ 4 × 100 = 25% |
|
🧠 Memory |
4 GB requested |
3 GB |
3 ÷ 4 × 100 = 75% |
|
🧠 Memory |
8 GB limit, no request |
2 GB |
2 ÷ 8 × 100 = 25% |
|
🖥️ GPU |
81,920 MB GPU memory (one 80 GB device) |
73,728 MB |
73,728 ÷ 81,920 × 100 = 90% |
Overall Efficiency
Overall Efficiency averages the CPU, Memory and GPU percentages that have a denominator. A resource with no denominator is excluded, not counted as zero — so a workload with no GPU averages two values, not three.
|
Resources present |
Overall Efficiency |
|---|---|
|
CPU, Memory and GPU |
(CPU % + Memory % + GPU %) ÷ 3 |
|
CPU and Memory only |
(CPU % + Memory %) ÷ 2 |
How the levels are calculated
The formula is the same at every level; what changes is whether values are averaged or totalled before dividing.
|
Level |
Rule |
|---|---|
|
Pod |
Usage and denominator averaged across the pod's containers, then divided — never summed, which would inflate the pod by its container count. |
|
Namespace |
Total usage of all pods ÷ total denominator, per resource, then averaged into Overall. |
|
Cluster |
Same as namespace, across all pods in the cluster. |
|
Summary cards |
Average of each cluster's Overall Efficiency for the selected month. |
Namespace and cluster levels are resource-weighted rather than an average of pod percentages, so a 0.1-core cron job doesn't count the same as a 200-core training pod.
Reading the numbers
-
Pod figures don't add up to the namespace figure. Pod rows use monthly averages; namespace and cluster rows use totals. Namespace totals do add up to their cluster total.
-
Efficiency is not capped at 100%. A workload consuming more than it requested exceeds 100% and is reported as-is — the request is set below actual consumption.
-
A low CPU or memory figure on a GPU workload is often a missing request, not waste. A sidecar with no request falls back to the node's full capacity, pulling the pod's averaged denominator up. Check the per-resource breakdown before treating a low Overall figure as reclaimable.
Verifying a figure
Every input is visible on the K8s Cost page. Filter to the same month and workload, read off usage and requests / limits / capacity (several rows for one pod name are its containers — average them), then divide and multiply by 100.
Small rounding differences are expected, as the dashboard calculates at full precision and rounds for display.
K8s Efficiency Chart
A bar chart tracking efficiency over time, with three controls:
-
Period — Last 1 month, Last 3 months, Last 6 months (default), Last 12 months, or a custom range.
-
Y-Axis — switch the chart between Overall Efficiency, CPU Efficiency, or Memory Efficiency.
-
Filter By — narrow the chart down by Provider, Cluster, Node Pool, Node, Namespace, Controller Kind, or Location. Each category expands to let you pick specific values, and there's a search box if you're looking for something specific. Clear All resets every filter at once.
Geo Chart
A world map showing where your efficiency data is coming from geographically. Use the Region dropdown to zoom into a specific part of the world instead of the global default.
K8s Efficiency Items
Below the charts, this table lists the individual pods (or other resource types) behind the numbers for the selected month.
[Screenshot 3 goes here — the K8s Efficiency Items table with its columns and a few data rows]
-
Columns shown by default: Month, Type, Name, Cluster, Namespace, CPU Efficiency, Mem Efficiency, Overall Efficiency, Pods Count.
-
Also available, hidden by default: ID, Location, Node, Pod — click the gear icon above the table to turn any of these on or off.
-
Click any column header to sort by it.
-
Use the Search box to filter rows by name or any visible field.
-
The download icon exports the current table view.
FAQs
Why don't my pod-level efficiency numbers add up to the namespace total?
Pod rows use monthly averages, while namespace and cluster rows use totals — so they're calculated differently and won't sum directly. Namespace totals do add up correctly to their cluster total, though.
Can efficiency go over 100%?
Yes — it's not capped. If a workload consumes more than it requested, the figure exceeds 100% and is reported as-is, which usually means the request was set below actual consumption.