
This dashboard provides a complete view of your datacenter utilization, allowing you to monitor CPU, memory, storage, GPU (where available), and overall resource usage across datacenters, clusters and hosts. With interactive charts, geo views, and detailed utilization metrics, you can analyze efficiency trends, identify underused resources, and uncover optimization opportunities. Advanced filters and drilldowns help you focus on specific datacenters or resources to drive better utilization and cost-effectiveness.
Why this matters: with cloud, an idle resource shows up as wasted spend you can point to directly. With owned datacenter hardware, that same waste shows up as low utilization instead: capacity you already paid for that's sitting mostly unused. This dashboard is what makes that visible, since there's no invoice line that flags it for you.
Key Metrics
Utilization Score
The utilization score widget shows the overall utilization percentage for the selected period. This allows you to see how much of your provisioned datacenter capacity is actually in use and how much is sitting idle.
The score is the average of CPU utilization and Memory utilization across all datacenters.
CPU Utilization
The CPU utilization widget shows the percentage of total datacenter CPU capacity in use for the selected period. This allows you to see how much of your provisioned CPU capacity is actually being used. Utilization is CPU usage divided by the CPU allocated to the host, as a percentage.
Memory Utilization
The Memory utilization widget shows the percentage of total datacenter memory capacity in use for the selected period. This allows you to see how much of your provisioned memory capacity is actually being used. Utilization is memory usage divided by the memory allocated to the host, as a percentage.
Storage Utilization
The Storage Utilization widget shows the percentage of total datacenter storage capacity in use for the selected period. This allows you to see how much of your provisioned storage capacity is actually being used.

GPU Utilization
The GPU Utilization widget appears only when the clusters onboarded for the selected datacenter have GPUs. It shows the percentage of total GPU capacity in use for the selected period. GPU utilization is shown for monitoring only. GPU cost is not calculated for VMware hosts.
Dashboard Views
Utilization Chart
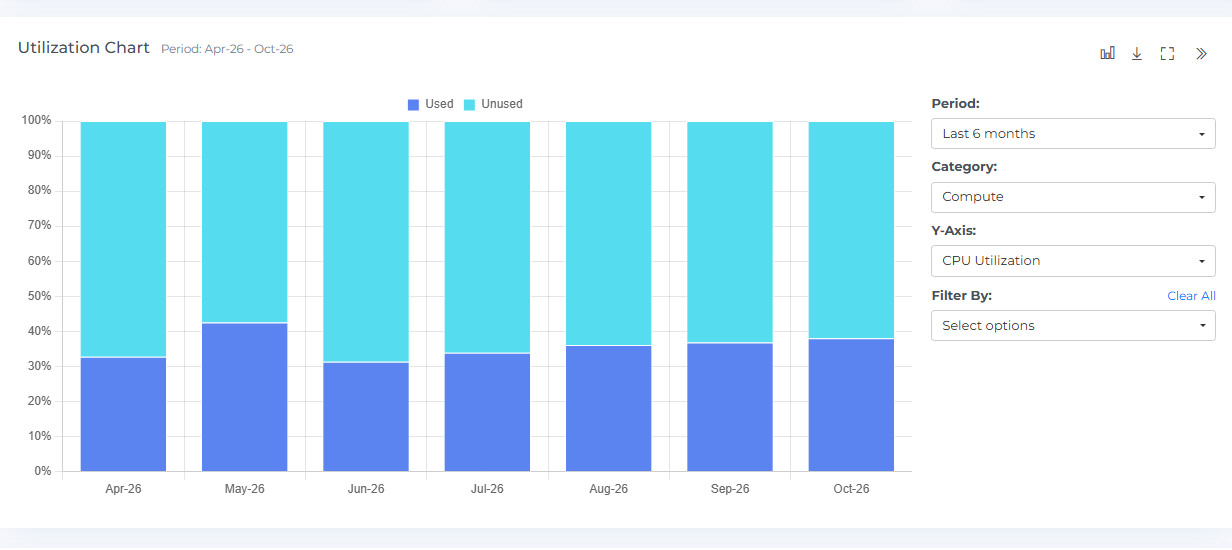
The Utilization Chart presents a graphical representation of the used and unused hours for each interval in the selected Period. You can hover your mouse over the chart to view the used and unused hours, as well as the utilization percentage for each interval. When you click on a bar in the chart, the datacenter Widgets, Geo Chart, and utilization items will display data accordingly.
You can expand or restore the view of the Utilization Chart using the Full-Chart View and Full-Row View icons. Additionally, you can download the chart by clicking the download icon. This can help you understand the distribution of your datacenter usage over time and identify any trends or patterns.
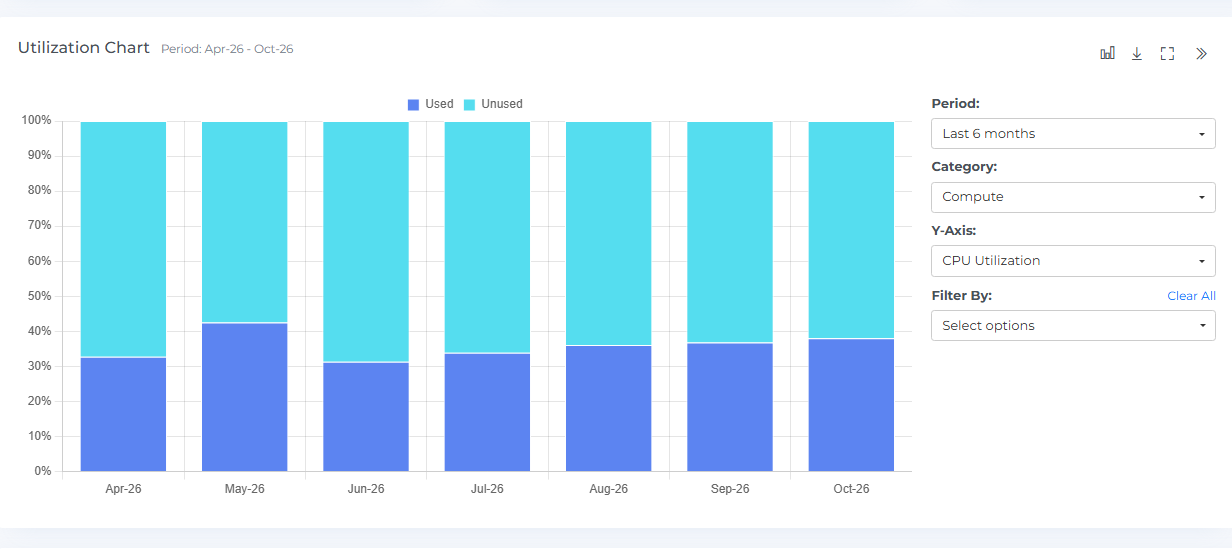
Use the Category selector to switch the chart between Compute and Storage utilization, and the Y-Axis selector to pick the specific metric to plot: CPU Utilization or Memory Utilization when Category is Compute, or Storage Utilization when Category is Storage. This lets you focus the chart on exactly the utilization dimension you care about, and it also determines which columns are relevant in the Utilization Items table below.
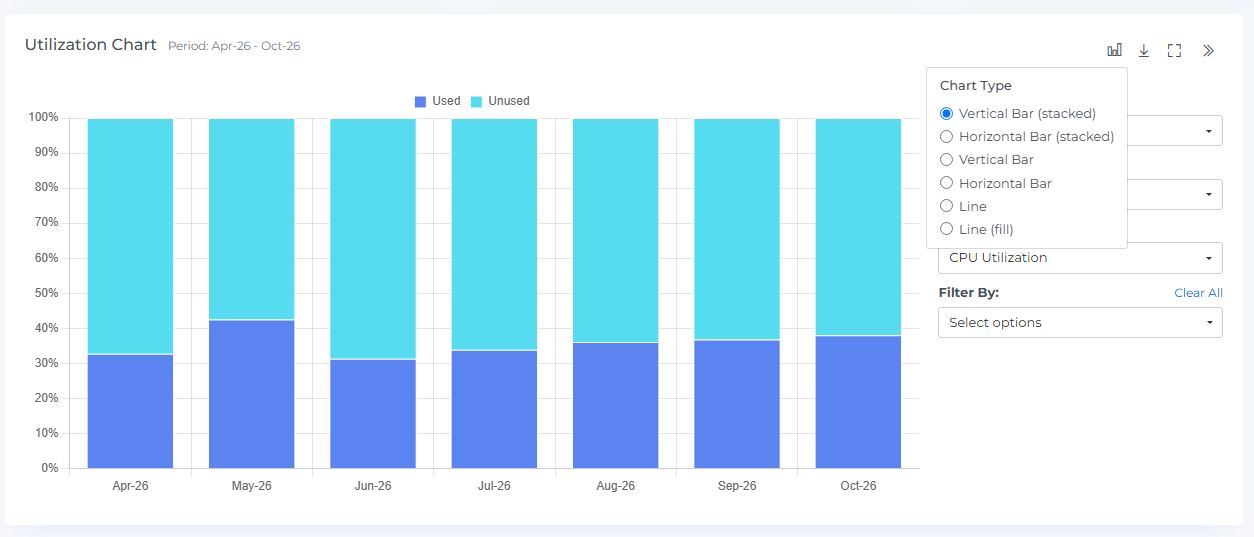
The Utilization Chart allows you to switch between different chart types, such as bar charts and line charts, to visualize the data in different ways. This feature allows you to choose the chart type that best represents the data and helps you understand your datacenter usage more effectively.
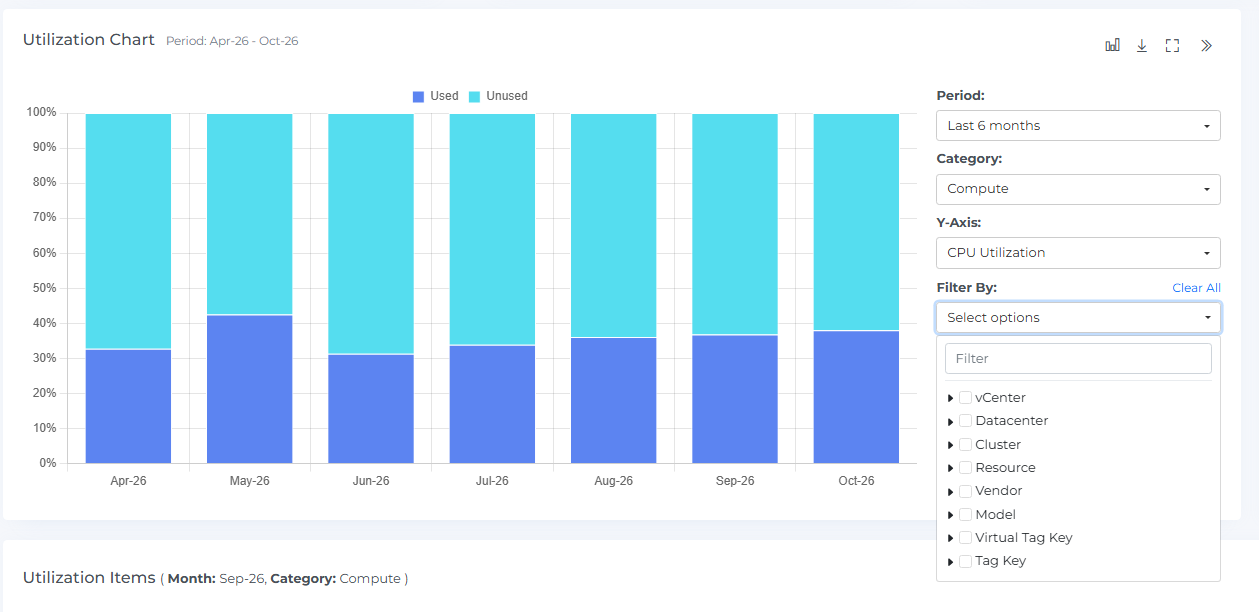
The Utilization Chart allows you to filter the data using the Filter By option. You can filter by vCenter, Datacenter, Cluster, Resource, Vendor, Model or Tag Key to narrow down the data and focus on specific aspects of your usage. This can help you better understand and analyze your datacenter usage.
Geo Chart
The datacenter Geo Chart displays the data points for the selected month. Each point is a datacenter location, placed using the Location, Latitude and Longitude entered on the datacenter form (Admin → Accounts → Datacenters). Hover your mouse over a point to see its utilization for the selected Category, for example "Datacenter (Compute) 37.38%". If there are two data points that overlap, a small magnifying glass icon is displayed.
Use the Region drop-down to change the area shown on the map. The Geo Chart shows the month selected on the Utilization Chart; click a bar in that chart to change it. This can help you understand the geographical distribution of your datacenter usage and identify any trends or patterns.

Utilization Items
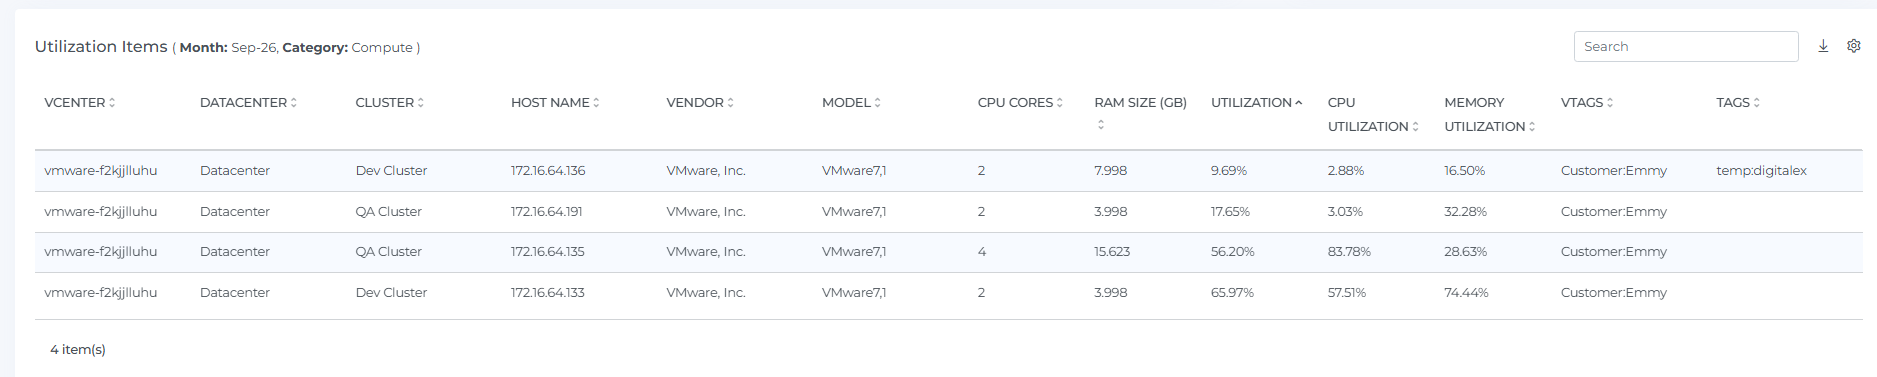
The Utilization Items table lists every resource for the selected month and Category, with columns for vCenter, Datacenter, Cluster, Host Name, Vendor, Model, CPU Cores, RAM Size (GB), overall Utilization, CPU Utilization, Memory Utilization, vTags, and Tags. This gives you the full per-host/resource detail behind the summary widgets and chart above.
vTags are the Virtual Tags applied to the resource, and Tags are the tags on the resource itself.
With Category set to Compute, the table shows CPU and Memory utilization. With Category set to Storage, it shows Storage utilization.

The Utilization Items can be sorted, searched, and downloaded. You can also click on the settings icon to change the way the data is displayed. The number of Utilization Items displayed will depend on the selection you make in the settings. This can help you more easily analyze and understand your datacenter usage.
Actions and Filters
Header Icons

Share
If you click on the "share" link, a link to the current page will be copied to your clipboard. You can then share this link with other team members, allowing them to access the same data and filters as you. This can be useful for collaborating with others and sharing information about your Datacenter Utilization page.
Bookmark
Click the Bookmark icon to save the current page's view, including your active filters, so you can return to it quickly later. You can access your saved bookmarks from your profile menu.
Subscription
Click the Subscription icon to set up a recurring email report of this page. See the Subscriptions page for full setup steps.
Datacenter Utilization Filters
Basic
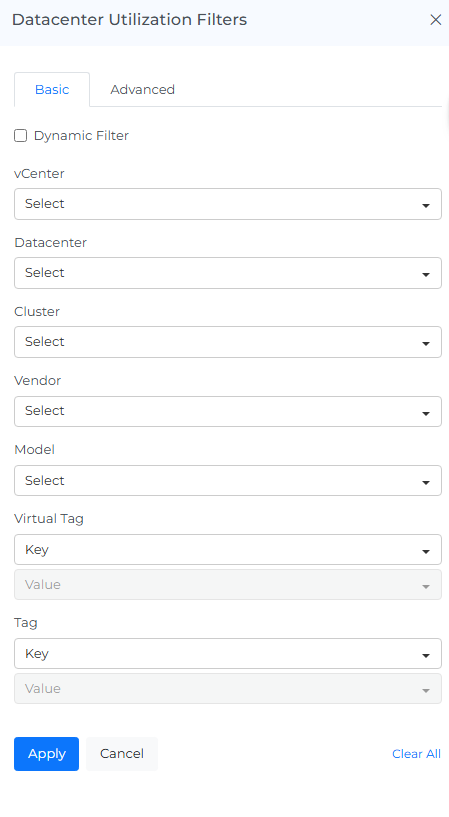
The filter option allows you to narrow down the data displayed on the page to specific criteria. You can use it to view utilization for a particular vCenter, Datacenter, Cluster, Vendor or Model, or by Virtual Tag or Tag. This can help you focus on specific aspects of your datacenter utilization to more effectively analyze and understand the data.
On selecting Dynamic Filter adjusts options based on previous selections. For example, choosing a Datacenter will update subsequent filters (e.g., Cluster, Vendor) to show only relevant data for that datacenter. This ensures efficient and context-sensitive filtering.
Advanced
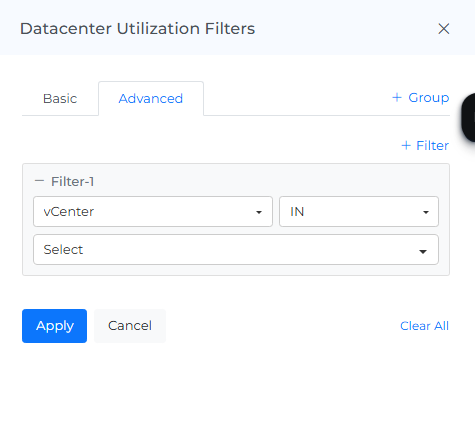
The "Advanced Datacenter Utilization Filters" feature use to apply detailed filters to refine search results. You can add multiple filters by selecting criteria like "Datacenter," choosing an operator (e.g., "IN"), and selecting values from dropdown menus. The interface includes options to apply or cancel changes and a "Clear All" button to reset filters.
Screenshot
If you click on the camera icon, you can take a screenshot of the current page and download it as a PDF file. This can be useful for saving a copy of the data or for sharing it with others.
Reload Option
The "reset" option allows you to clear all filters and selections from the page, returning it to the default view. This can be useful if you want to start over or view the data in its original form.
Info
The "last updated" date and time stamp show when the data on the page was last refreshed. This can be useful for understanding the age of the data and determining if it is up to date.
Datacenter data is collected by the appliance every 24 hours, so values can be up to a day old.
Help
If you click on the "?" icon, you can access the help documentation for the page. This can provide you with additional information and guidance on using the page and its features.
FAQs
Does a low utilization percentage mean something is broken?
No, it means the capacity is provisioned but not being used, which is a cost/efficiency signal, not an error. Since owned datacenter hardware doesn't show idle capacity as a separate invoice line the way cloud does, this dashboard is the way to actually see that gap.
Can I see utilization for a specific host or cluster rather than the whole datacenter?
Yes, use the Datacenter Utilization Filters (Basic or Advanced) to narrow the view by vCenter, datacenter or cluster, or search the Utilization Items table for a host name.
What's the difference between Category and the Y-Axis selector on the Utilization Chart?
Category (Compute or Storage) picks which pool of resources the chart and Utilization Items table cover. Y-Axis then picks the specific metric to plot within that pool: CPU or Memory Utilization for Compute, Storage Utilization for Storage.
Why is utilization different from cost on the Datacenter Cost page?
Utilization shows how much of your capacity was used. Cost applies your configured rates to both the used and the idle capacity. See "Used and idle cost" on the Datacenter Cost page.
Why does storage utilization show 0% or no value?
The storage is not used by the cluster, or it is not attached to the cluster.