
The cost dashboard allows you to view and manage the costs associated with the datacenter in one central location. This can help you to better understand your spending and identify potential cost savings. Additionally, the dashboard allows you to customize your view to focus on specific datacenter, making it easier to manage and track your costs.
Why this matters: datacenter cost isn't billed the way cloud cost is (there's no per-resource invoice line to point to). It's derived from your own infrastructure (clusters, hosts, resources) and the rates you've configured for them, so this dashboard is the primary way to see where that cost is actually concentrated, down to the specific cluster or host driving it.
Key Metrics
Total Costs
The total costs widget allows you to view the total costs associated with your datacenters. When you onboard a datacenter, the cost data for that datacenter will be displayed starting from the month in which the datacenter was onboarded.
The percentage increase and decrease values shown in the widget are based on the previous month's data. This means that the widget will not show percentage increase or decrease values for the first month in which data is available, nor for the current month.
Additionally, the widget includes a forecast for the current month's costs, which can help you plan and budget accordingly. This widget can be particularly useful for identifying potential cost savings and managing expenses.
Top Clusters
The top clusters widget allows you to view the top clusters in terms of your costs. The widget displays a donut chart, with each slice of the donut representing one of the top clusters. The size of the slice corresponds to the cost of that cluster.
You can mouse over the donut chart to view the cost of a particular cluster. You can also click on a slice of the donut to view the data for that cluster in more detail. When a user clicks on a slice, the widget will display a cost chart and a list of cost items for that cluster, allowing you to see how the cluster's costs are distributed across different categories.
The top clusters widget is useful to identify the clusters that are contributing the most to an organization's overall costs. It can help you to better understand your spending and identify opportunities for cost savings.
Top Categories
The Top Categories widget displays a list of the top-costing categories, along with the percentage increase or decrease in cost from the previous month. You can click on a specific category in the table to filter the page down to that category: the Cost Chart and the data table below it will update to reflect the selection.
This widget can help you identify the categories that are contributing the most to your overall datacenter costs, and can allow you to understand the changes in cost from one month to the next. By examining the cost data for these top-costing categories, you can identify opportunities to optimize your resource usage and reduce costs.
Top Hosts
The Top Hosts widget displays a pie chart showing the top-costing Hosts for your resources. You can hover your mouse over the pie chart to view the cost of each particular host.
You can also click on a specific host in the pie chart to view the data for that host. When you click on a host, the cost chart and cost items will display data accordingly. This can help you understand how your resource costs are distributed across hosts and identify any trends or patterns.
By examining the data for the top-costing Hosts, you can identify opportunities to optimize your resource usage and reduce costs on specific hosts.

Used and idle cost
Datacenter cost is calculated from the CPU, memory and storage rates you configure for your datacenters and hosts. It is split into used cost and idle cost.
-
Used cost is the cost of host capacity that VMs used. For CPU, a VM's used cost is based on the greater of its CPU usage and its reserved CPU.
-
Idle cost is the cost of host capacity that no VM used. You still pay for this capacity, so it appears as cost with no workload attached. Idle cost is reported separately from used cost.
-
Total cost = used cost + idle cost.
How idle CPU cost is calculated. For each host, idle CPU cost = the host's total CPU cost − the used CPU cost of the VMs on that host. The idle cost is shared equally across the VMs on the host, so a VM's total CPU cost = its used cost + its share of the idle cost.
CPU shares are not taken into account, because shares only apply when resources are under contention.
Example (illustrative numbers). A host costs $1,000 for the month. Its VMs used capacity worth $300, so idle cost is $700 and total cost is $1,000. Idle cost is 70% of the total, which means most of the host's capacity was not used.
GPU. Datacenter cost covers CPU, memory and storage. GPU cost is not calculated for VMware hosts.
A high idle share means capacity is provisioned but not consumed. It is a signal to reclaim hardware or hold off on new purchases. See Datacenter Utilization for the matching utilization view.
Dashboard Views
Widget Builder
The Top Clusters, Top Categories, and Top Hosts widgets can be customized to suit your specific needs. Click the Customize icon next to the widget name (this reveals Edit and Restore buttons for adjusting the data displayed in the widget based on your preferences).
Use the "Restore" button to reset the widget's customization back to its default configuration.
In addition to the top-costing items displayed by default, you can also view the top 100 clusters, categories, and hosts by clicking on the "View more" option. This can provide you with more detailed information about the top-costing items and help you identify opportunities to optimize your resource usage and reduce costs.

Cost Chart
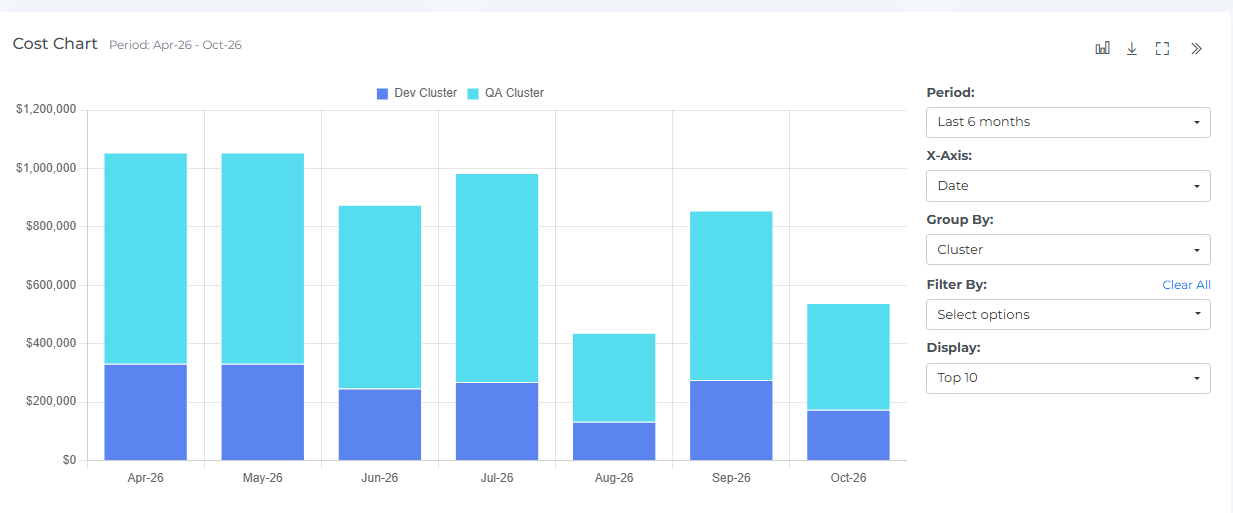
The cost chart is a graphical representation of your resource costs over time. It shows the costs for different months and allows you to see how your costs have changed over time. You can hover your mouse over the chart to view the cost for a specific month.
The cost chart includes clickable bar graphs, which you can click on to view the cost items for that specific month. This can help you understand the specific items that contributed to the overall cost for that month.
You can also see a forecast of your future costs by hovering your mouse over the bar graph. This can help you understand how your costs are expected to change in the future and allow you to plan accordingly.
In addition to these features, you can also expand or restore the view of the cost chart using the Full-Chart View and Full-Row View icons, and you can download the cost chart by clicking on the download icon.
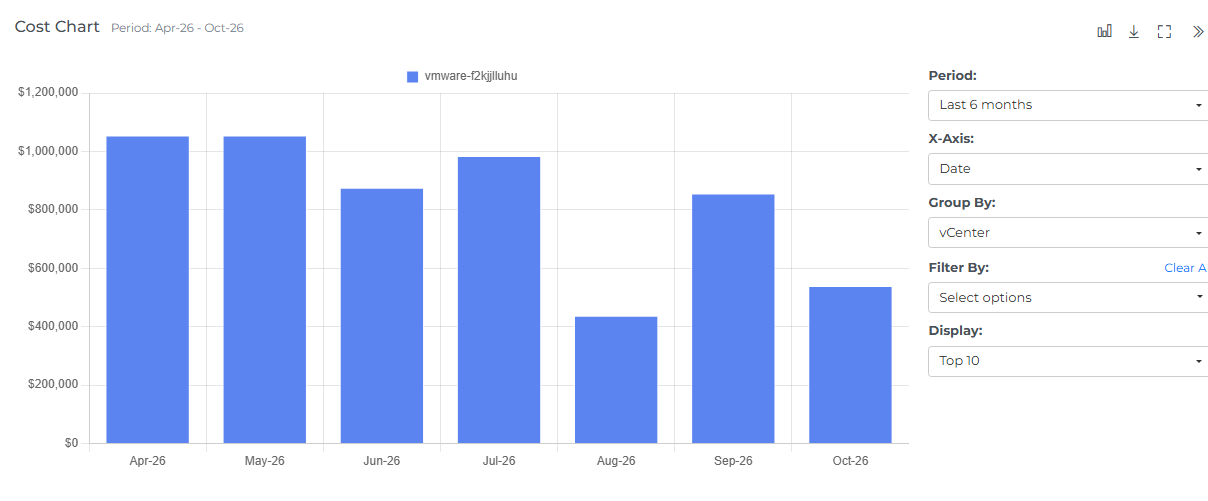
The cost chart can be filtered using various options to help you focus on the data that is most relevant to you. You can view data in either monthly intervals or daily intervals, depending on your needs. If you select daily intervals, you will only be able to view data for the past 30 days.
You can also change the X-axis of the cost chart to focus on different aspects of your resource costs. This can help you understand how different factors, such as vCenter, cluster or host, are impacting your overall costs.
In addition to these options, the cost chart also includes different chart types that you can use to view your cost data in different formats. You can select the "All" option to view all the data in the cost chart, or you can choose to view specific data points to focus on specific aspects of your costs. By using these filters and chart types, you can more effectively analyze and understand your resource costs
Geo Chart
The Geo chart is a graphical representation of your resource costs by location. It displays data points for the selected month and allows you to see how your costs are distributed geographically. You can hover your mouse over the data points to view the location name and the cost at that location. Locations come from the Location, Latitude and Longitude entered on the datacenter form (Admin → Accounts → Datacenters).
The Geo chart also includes clickable data points, which you can click on to view the associated cost data in the cost items table. This can help you understand the specific items that contributed to the cost for that location. When you click on a data point, the cost chart and cost items will display data accordingly.
The maroon color in the Geo chart indicates locations where you have incurred higher costs. If there are two data points that overlap, a small magnifier icon will be displayed.
You can change the location and month from the drop-down menus to view data from different locations and months. This can allow you to understand how your resource costs have changed over time and identify trends or patterns.
You can also see the cumulative cost for the Global & Unknown Hosts in the below the geo chart

Cost Breakdown Table
Below the Cost Chart, a table lists your costs grouped by the current Group By selection (for example, by vCenter), broken out by month, with a TOTAL row and column. This gives you the same data as the chart in table form, useful for comparing exact figures across months.
Clicking a cluster, host, or category in the widgets above (or a point on the Geo Chart) applies it as a page filter rather than opening a separate item-level table; the Cost Chart and this table both update to reflect the filtered selection.
Actions and Filters
Header Icons

Share
Click on the Share icon, copy the link of the current page, and filter if anywhere you can share it with other team members.
Screenshot
Clicking on the Camera icon, take a Screenshot of the current page, and download it in a pdf file.
Cost Options
Use Cost Field to choose how cost is measured. The selection applies to the whole page.
-
Actual: cost based on the capacity your VMs used. For CPU, this is the greater of a VM's CPU usage and its reserved CPU.
-
Chargeable: cost based on the capacity allocated to each VM. For CPU, this is based on its allocated vCPUs. Because allocated vCPUs can exceed the physical cores they run on, Chargeable CPU cost can be higher than Actual CPU cost.

Cost Filter
Basic
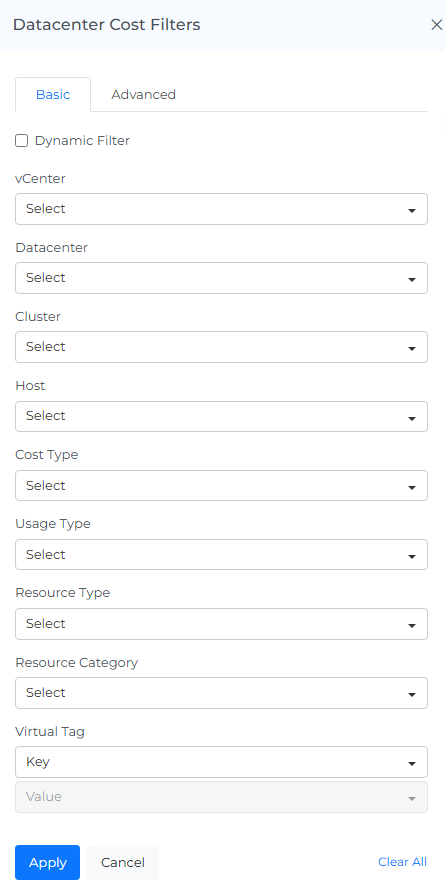
You can filter the complete page using this option. For Example, if you want to view the cost of Datacenter, select the Datacenter filter or if you want to view the cost of a particular Cluster, Host or Resource Type
On selecting Dynamic Filter adjusts options based on previous selections. For example, choosing a Datacenter will update subsequent filters (e.g., Cluster,Host) to show only relevant data for that datacenter. This ensures efficient and context-sensitive filtering.
Advanced
The "Advanced Datacenter Cost Filters" feature use to apply detailed filters to refine search results. You can add multiple filters by selecting criteria like "Datacenter," choosing an operator (e.g., "IN"), and selecting values from dropdown menus. The interface includes options to apply or cancel changes and a "Clear All" button to reset filters.

Info
Last updated date & time.
Reload Option
It clears all the filters, and selections from the page and shows you the default page.
Help
You can use the Help Page Documentation by Clicking the '?' Help icon.
FAQs
Why don't I see a percentage change for the first month of data?
Percentage increase/decrease needs a previous month's data to compare against. The first month a datacenter is onboarded has nothing to compare to, so no percentage change is shown (the same applies to the current, still-in-progress month).
Why isn't there a per-resource invoice like there is for cloud cost?
Datacenter cost isn't billed by a provider the way cloud cost is: it's derived from your own infrastructure (clusters, hosts, resources) and the rates you've configured for them. This dashboard is the primary way to see where that cost is concentrated, since there's no invoice to check instead.