
The GenAI cost dashboard allows you to view and manage the costs associated with the providers in one central location. This can help you better understand your spending and identify AI cost savings. Additionally, the dashboard allows you to customize your view to focus on specific accounts or providers, making it easier to manage and track your AI costs.
Why this matters: unlike a fixed cloud resource, GenAI cost tracks usage directly: every prompt, every token, every model call adds to the bill in real time. A prompt change, a new feature adoption, or a shift to a more expensive model can move the number meaningfully within days rather than months. Breaking spend down by account, model, and operation is what lets you catch that shift while it's still small.
Key Metrics
Total Costs
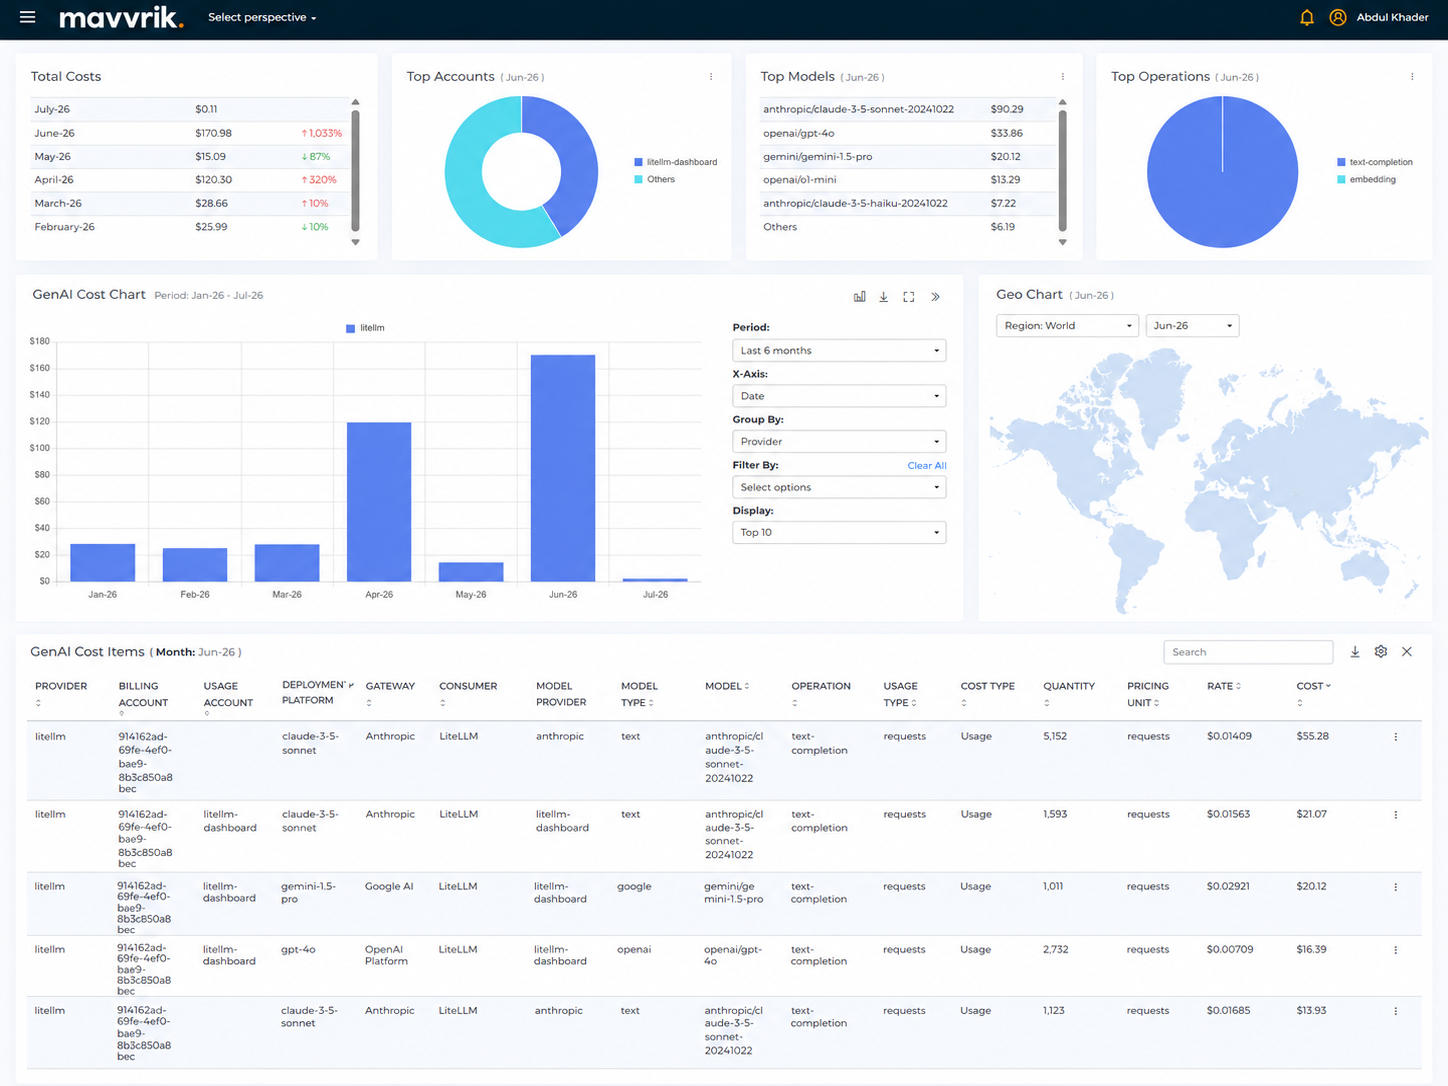
The total costs widget allows you to view the total AI costs associated with your providers. When you onboard projects, the cost data for that account will be displayed starting from the month the account was onboarded.
The percentage increase and decrease values shown in the widget are based on the previous month's data. This means that the widget will not show percentage increase or decrease values for the first month in which data is available nor for the current month.
Track LLM Cost with AWS Inference Profiles
You can break down your Bedrock costs by application, team, or environment, without extra tagging work, using AWS Inference Profiles.
Mavvrik automatically ingests cost allocation tags from your AWS Inference Profiles. That means when you tag a profile (e.g., team=mlops, app=chatbot), any GenAI spend flowing through it is visible in Mavvrik GenAI dashboard.
This makes it simple to segment and report on GenAI costs by application, team, use case, or environment, all without rewriting pipelines or manually tagging every call.
For more details refer Track LLM Cost with AWS Inference Profiles
Track LiteLLM usage and cost directly in Mavvrik.
The LiteLLM integration brings visibility into LLM usage and cost routed through your LiteLLM gateway, so you can see how model usage across providers contributes to overall AI spend. Review usage patterns, model-level activity, and cost in one place, and pinpoint which models, providers, teams, or applications are driving spend over time.
Top Accounts
The top accounts widget allows you to view the top accounts in terms of your costs. The widget displays a donut chart, with each slice of the donut representing one of the top accounts. The size of the slice corresponds to the cost of that account.
You can mouse over the donut chart to view the AI cost of a particular account. You can also click on a slice of the donut to view the data for that account in more detail. When a user clicks on a slice, the widget will display a AI cost chart and a list of cost items for that AI account, allowing you to see how the AI account's costs are distributed across different categories.
The top accounts widget is useful to identify the accounts that are contributing the most to an organization's overall AI costs. It can help you to better understand your spending and identify opportunities for AI cost savings.
Top Models
The Top Models widget lists the models generating the most AI cost for the selected month, along with the percentage increase or decrease from the previous month. This helps identify which specific models are driving spend, rather than just an overall total.
Top Operations
The Top Operations widget shows a donut chart breaking down AI cost by operation type for the selected month. Which operation type dominates depends entirely on your own usage pattern; click a slice to drill into the cost chart and cost items for that operation.
Dashboard Views
Widget Builder
The Top Accounts, Top Models, and Top Operations widgets can be customized to suit your specific needs. Click the Customize icon next to the widget name; this reveals Edit and Restore buttons for adjusting the data displayed in the widget based on your preferences.
Use the "Restore" button to reset the widget's customization back to its default configuration.
The Edit button opens the Edit Widget dialog, where you can change the widget name, the dimension (for example Provider, Billing Account, Usage Account, Model or Operation), the chart type (Table, Donut, Pie, Line, Vertical Bar or Horizontal Bar), the number of items (Top 5, Top 6, Top 7 or Top 8) and the period (Current month, Last month or 2 months ago). Click on Save to apply the changes or Cancel to close the dialog.
Gen AI Cost Chart
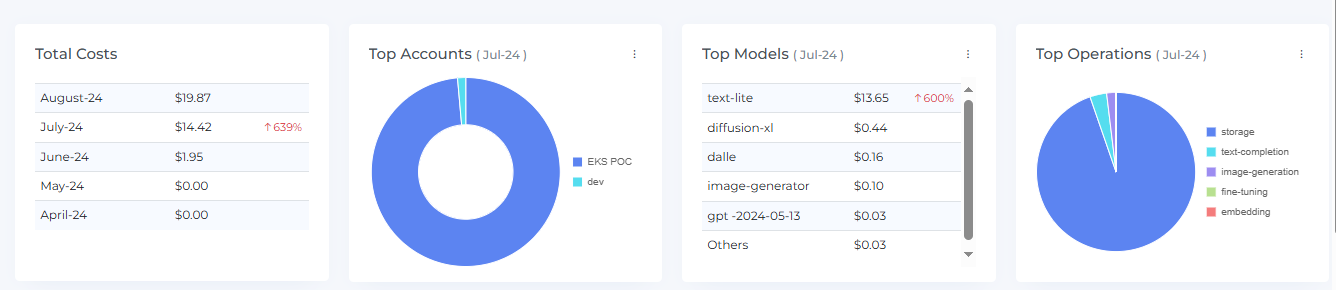
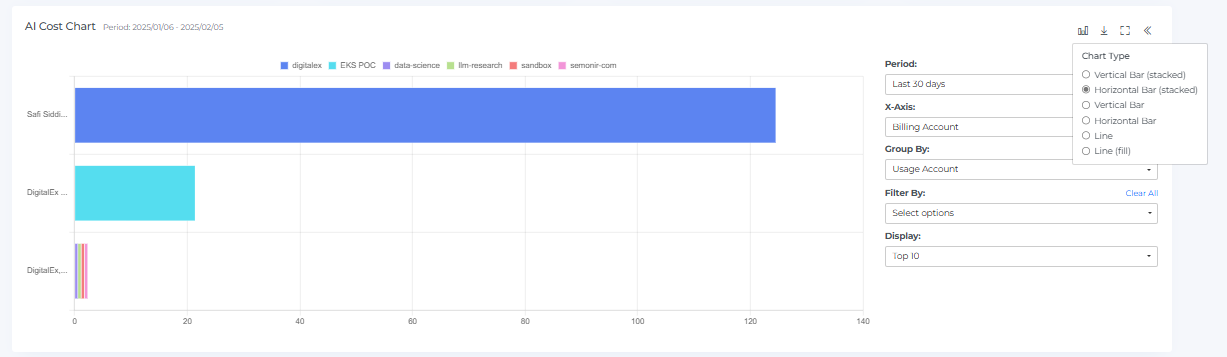
The Gen AI Cost Chart is a graphical representation of your services AI costs over time. It shows the AI costs for different months and allows you to see how your AI costs have changed over time. You can hover your mouse over the chart to view the AI cost for a specific month.
The Gen AI Cost Chart includes clickable bar graphs, which you can click on to view the AI cost items for that specific month. This can help you understand the specific items that contributed to the overall AI cost for that month.
You can also see a forecast of your future AI costs by hovering your mouse over the bar graph. This can help you understand how your AI costs are expected to change in the future and allow you to plan accordingly.
In addition to these features, you can also expand or restore the view of the Gen AI Cost Chart by clicking on the Full-Chart View icon, and you can download the chart data by clicking on the Download CSV icon. The Chart Type icon changes how the chart is drawn.
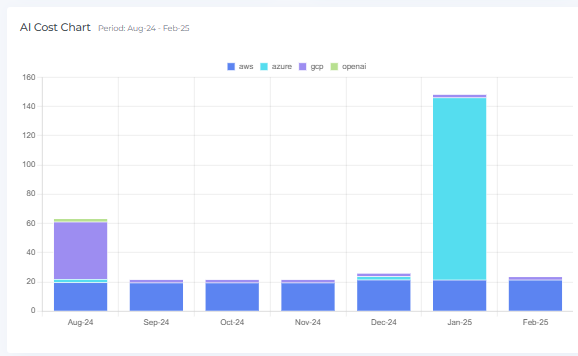
You can also view the chart in full-row mode by clicking on the Full-Row View icon
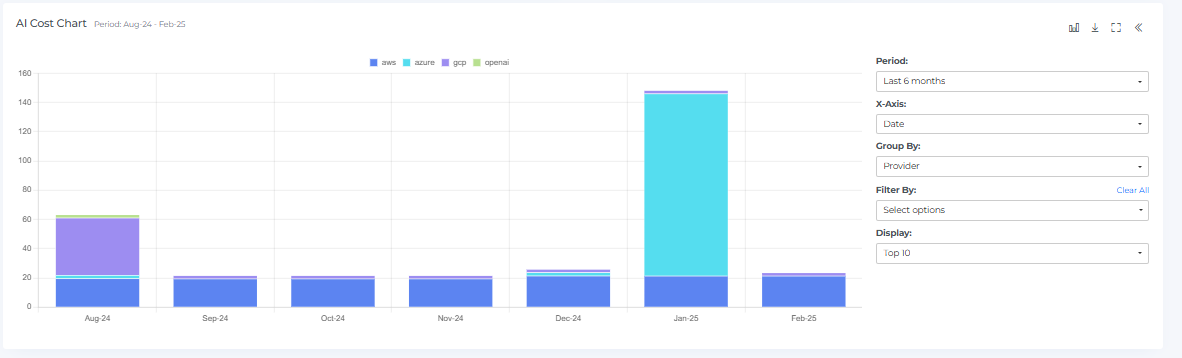
The Gen AI Cost Chart can be filtered using various options to help you focus on the data that is most relevant to you. The "Period" selection allows you to filter cost data by different time ranges: Monthly (Last 1 month, Last 3 months, Last 6 months, Last 12 months or Custom months), Weekly (Last 4 weeks, Last 6 weeks, Last 8 weeks, Last 10 weeks or Custom weeks), or Daily (Last 7 days, Last 14 days, Last 30 days, Last 60 days or Custom days). This helps analyze spending trends over specific timeframes.
You can also change the X-Axis of the Gen AI Cost Chart to Date, Billing Account, Usage Account or Model to focus on different aspects of your AI costs. This can help you understand how these factors are impacting your overall AI costs.
Next to the chart you will also find Group By, Filter By and Display options. Group By offers Provider, Billing Account, Usage Account, Resource Group, Location, Platform, Gateway, Cost Type, Usage Type, Consumer, User, API Key, Model Provider, Model Type, Model, Operation, Virtual Tag and Tag. Filter By opens a searchable list with Provider, Billing Account, Usage Account, Resource Group, Location, Platform, Cost Type, Usage Type, User, API Key, Model Provider, Model Type, Model, Operation, Virtual Tag Key and Tag Key; click on Apply to update the chart. Display offers Top 10, Top 20, Top 30, Top 50 and Top 100. The Chart Type icon offers Vertical Bar (stacked), Horizontal Bar (stacked), Vertical Bar, Horizontal Bar, Line and Line (fill). By using these filters and chart types, you can more effectively analyze and understand your service AI costs.
Geo Chart
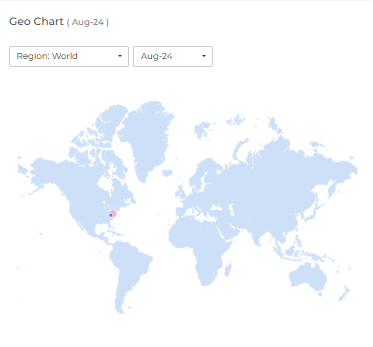
The Geo chart is a graphical representation of your service AI costs by region. It displays data points for the selected month and allows you to see how your AI costs are distributed geographically. You can hover your mouse over the data points to view the region name and the AI cost of that region.
The Geo chart also includes clickable data points, which you can click on to view the associated AI cost data in the AI cost items table. This can help you understand the specific items that contributed to the AI cost for that region. When you click on a data point, the AI cost chart and AI cost items will display data accordingly.
If there are two data points that overlap, a small magnifier icon will be displayed.
You can change the Region (World, Americas, Europe, Asia, Oceania or Africa) and the month from the drop-down menus to view data from different regions and months. This can allow you to understand how your service AI costs have changed over time and identify trends or patterns.
The table below the charts lists your AI costs by the Group By dimension (Provider by default), with a column for each month and a TOTAL row and column. Additionally, you can click on specific table data to access related AI cost items.

Cost Items
The AI cost items feature displays the top detailed AI costs for the month you clicked. This can provide you with a comprehensive view of your service AI costs and help you identify opportunities to optimize your service usage and reduce costs.
The Gen AI Cost Items table includes these columns: Provider, Billing Account, Usage Account, Platform, Model Provider, Model Type, Model, Operation, Usage Type, Cost Type, Quantity, Pricing Unit, Rate, Cost, Location, vTags and Tags. Each row has a View Details menu, and the icons next to the table heading are Download CSV, Settings and Close. You can sort, search, and download the AI cost items to better understand your AI service costs and identify areas for optimization.
By examining the data in the cost items table, you can identify the top-costing items and take action to optimize your service usage and reduce AI costs. You can also use the data in the cost items table to understand trends and patterns in your AI service costs over time.
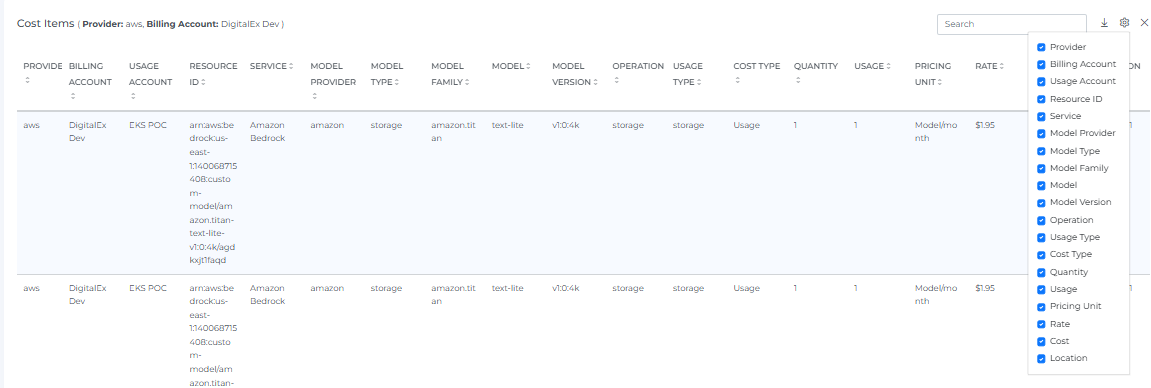
When you click on widgets, AI cost chart, or geo points, the cost items table will display the associated AI cost data for the selected item. For example, if you click on a data point in the geo chart, the AI cost items table will display the AI cost data for that specific region.
The AI cost items table includes a variety of features that can help you understand and analyze your service AI costs. You can sort the data in the table to view it in different orders, search for specific items using keywords, and download the data to share it with others or analyze it further.
You can also customize the view of the AI cost items table by clicking on the Settings icon. This allows you to choose which data points to display and how they are organized. By using these features, you can more effectively analyze and understand your service AI costs and identify opportunities for optimization.
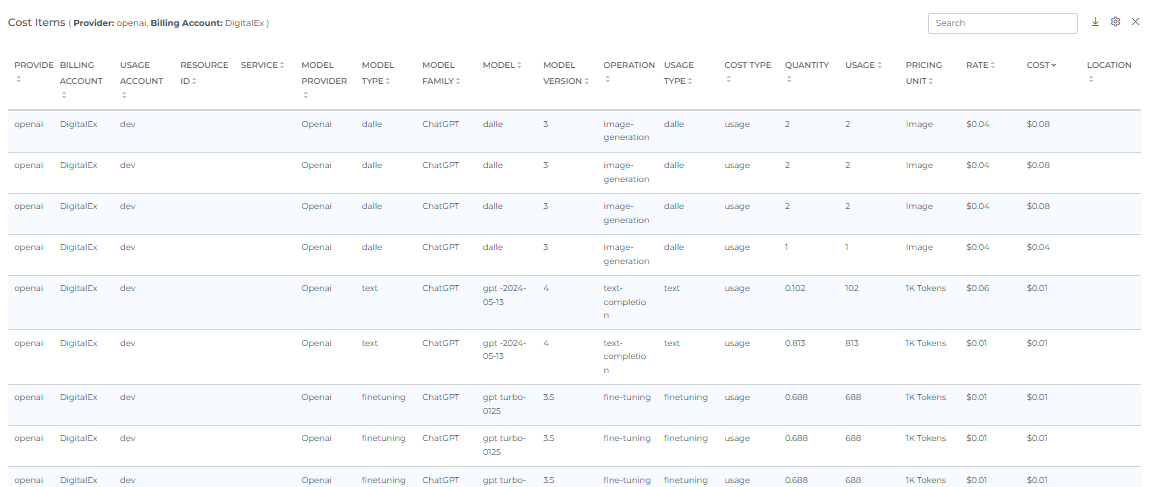
Use the close button to exit the service item list and return to the table view.
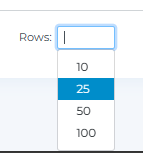
When you select the number of rows, you will be able to view that same quantity of rows on the page.
Actions and Filters
Header Icons

Share
Click on the Share icon, copy the link of the current page, and filter if anywhere you can share it with other team members.
Bookmark
Click the Bookmark icon to save the current page's view, including your active filters, so you can return to it quickly later. You can access your saved bookmarks from your profile menu.
Subscription
Click the Subscription icon to set up a recurring email report of this page. See the Subscriptions page for full setup steps.
Screenshot
Clicking on the Camera icon, take a Screenshot of the current page, and download it in a pdf file.
Info
Click on the Info icon to see when the data on this page was last updated. It shows the Last update date and time.
Filters
Basic
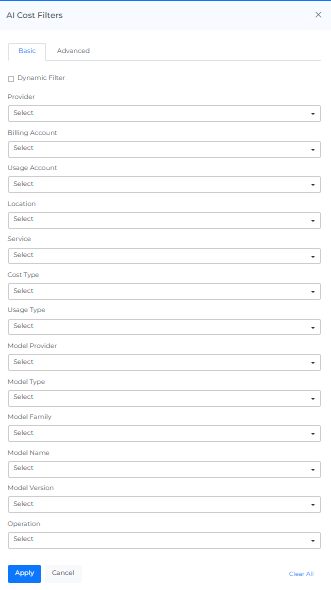
Click on the Filters icon to open the Gen AI Cost Filters panel, which has Basic and Advanced tabs. You can filter the complete page using the Basic tab. For Example, if you want to view the AI cost by provider, select any one filter, or if you want to view the AI cost of a particular Billing Account, Usage Account, Cost Type or Location, select it. The Basic tab lists Provider, Billing Account, Usage Account, Resource Group, Location, Platform, Cost Type, Usage Type, User, API Key, Model Provider, Model Type, Model Name, Operation, Virtual Tag and Tag.
On selecting Dynamic Filter adjusts options based on previous selections. For example, choosing a Provider will update subsequent filters (e.g., Billing Account, Usage Account) to show only relevant data for that provider. This ensures efficient and context-sensitive filtering.
Advanced
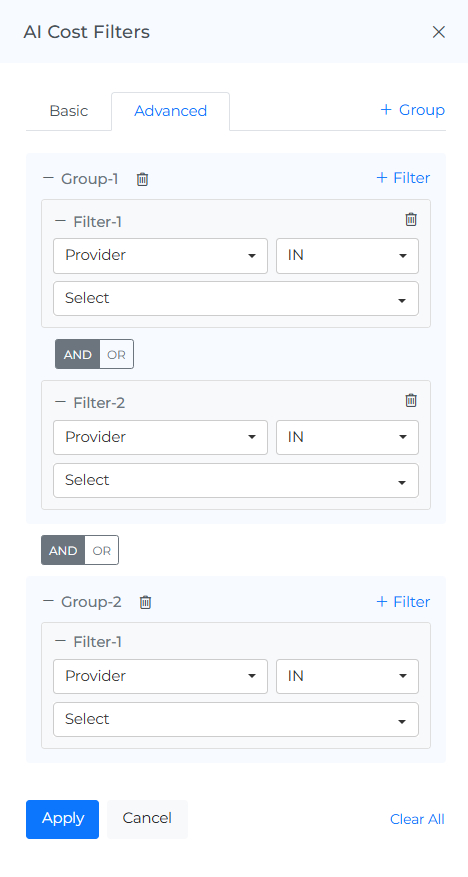
The "Advanced AI Cost Filters" feature use to apply detailed filters to refine search results. You can add multiple filters by selecting criteria like "Provider," choosing an operator (e.g., "IN"), and selecting values from dropdown menus. The interface includes options to apply or cancel changes and a "Clear All" button to reset filters.
Reload Option
It clears all the filters, and selections from the page and shows you the default page.
Help
You can use the Help Page Documentation by Clicking the '?' Help icon.
FAQs
Do I need to manually tag anything to break down Bedrock costs by team or app?
No, if you're already using AWS Inference Profiles with cost allocation tags (e.g. team=mlops), Mavvrik ingests those automatically. No extra tagging work or pipeline changes needed.
What's the difference between AWS Inference Profiles and the LiteLLM integration?
They cover different setups. Inference Profiles is specifically for breaking down AWS Bedrock costs using tags you've already applied there. LiteLLM is for tracking usage and cost routed through your own LiteLLM gateway, potentially across multiple providers, not just Bedrock.