.png)
Using Cost Anomaly
Cost Anomaly Detection is designed to help you reduce unexpected costs and gain greater control over your expenses. When you set up an anomaly, Mavvrik will send you notifications via email or other channels to alert you to any anomalies detected. This allows you to take timely action to address any potential issues. This feature helps users customize anomaly alerts based on financial values or percentage changes.
Why this matters: a simple "cost went up" threshold catches obvious spikes, but misses cases where spend is climbing steadily and never technically crosses a fixed number — or flags normal seasonal patterns as false alarms. Anomaly detection instead compares current spend against a baseline built from six months of historical trend, so what gets flagged is genuinely unusual for that specific service or account, not just a number that happens to be high.
For anomaly detection, we establish a reliable baseline by analyzing historical trends from the past six months, rather than relying only on day-over-day or last-30-day comparisons
Page overview
Alongside the "Month" selector (defaults to None), the page header includes Share, Bookmark, Subscription, Screenshot, Filters, Settings (opens Anomaly Settings — see below), Info, Reload, and Help icons.
Four summary widgets (all "Last 30 Days") sit above the Anomalies table: Total Anomalies, Total Cost Impact, Total Account Impact, and Total Location Impact.
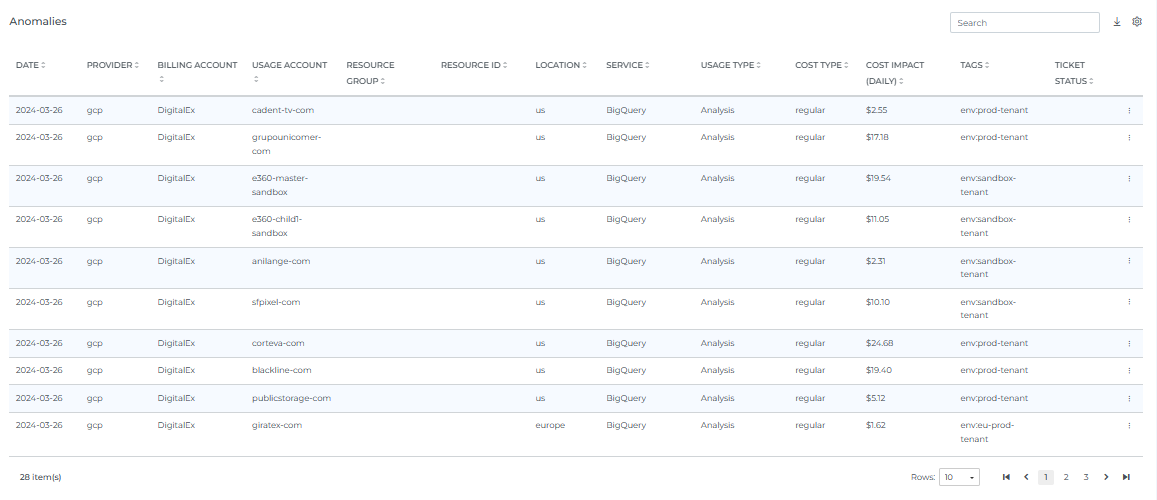
The Anomalies table's columns are: Date, Provider, Billing Account, Usage Account, Resource Group, Resource ID, Location, Service, Usage Type, Cost Type, Cost Impact (Daily), vTags, Tags, Ticket Status, and Action.
Steps to Set Cost Anomaly
-
Login with user roles as Owner/Editor
-
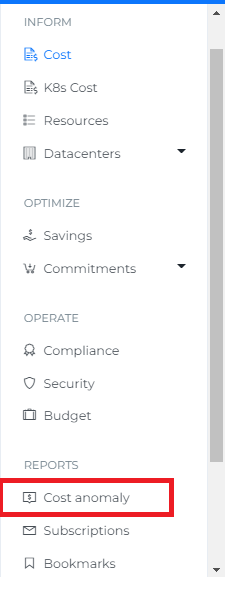
Click on Menu
-
Click on Cost Anomaly
-
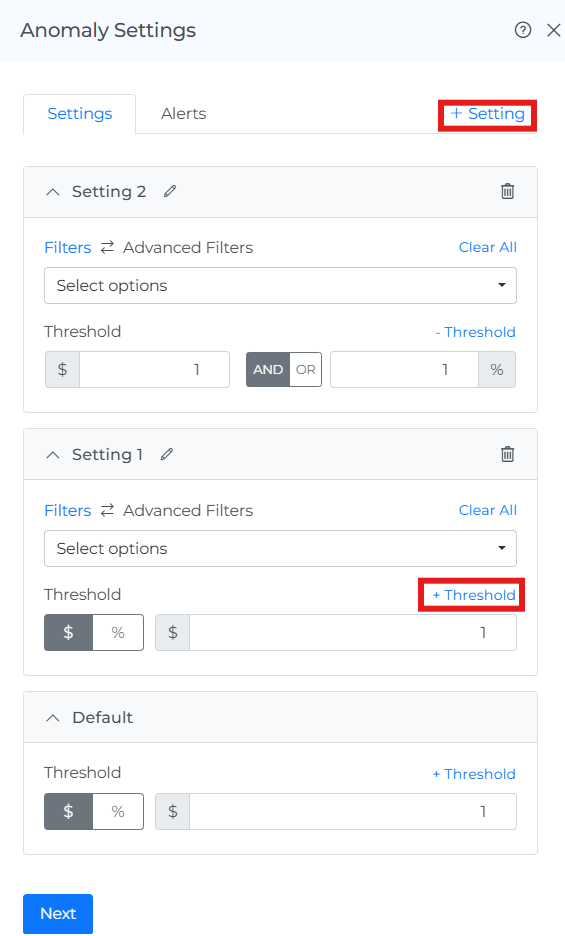
Click on the Settings icon in the page header to open Anomaly Settings.

The Threshold Configuration conditions for anomaly detection:
-
Threshold Value: Set a numerical value for triggering alerts.
-
Unit Selection: Choose between $ ("Amount above expected cost") or % ("Percent above expected cost").
-
Logical Conditions: Once you add a second threshold condition, an AND (both conditions must be met) / OR (either condition triggers an alert) choice appears between them.
-
Every tenant starts with a single Default Setting tab, which acts as a catch-all (implicitly scoped to everything not covered by another Setting). Click + Setting if you want to configure anomaly detection for a particular Account/Service/Tag etc. — this creates a new, independently-named tab alongside Default.
How multiple Settings tabs work: each Setting you add is its own tab with its own Filters/Advanced Filters (scoping it to, say, a specific Service or a specific Billing Account + Tag combination) and its own independent Threshold configuration. The Default tab has no filters — it always covers everything not matched by one of your other named Settings, which is why it's effectively "Scope: All Others." You can have as many scoped Settings as you need, each tuned with its own threshold.
-
Enter the Threshold value
-
Click on +Threshold button to add multiple condition
-
Switch to the Alerts tab to configure Alerts
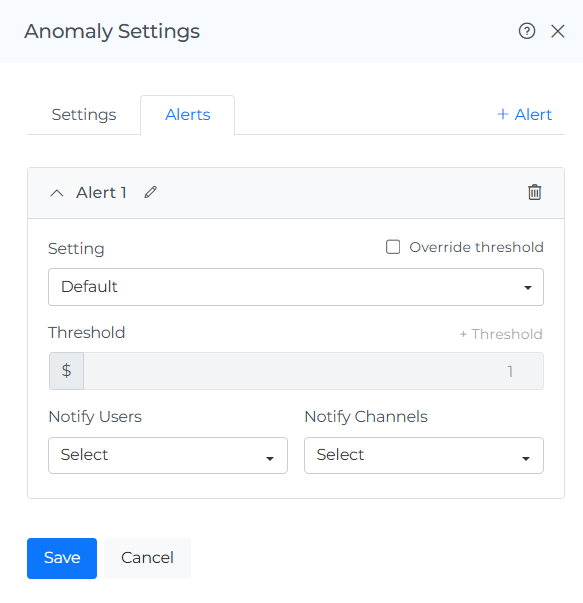
The Alerts tab uses the same multi-tab pattern as Settings. Click + Alert to add a new, independently-named Alert configuration. Each Alert config includes:
-
A Setting dropdown — pick which of your Settings tabs (Default, or one of your named scoped Settings) this Alert applies to.
-
An Override threshold checkbox — leave it unchecked to use that Setting's own threshold, or check it to set a different $ threshold just for this Alert (the threshold field is disabled until you check this box).
-
Its own independent Notify Users and Notify Channels selections.
This means you can route different Settings to different people — e.g. an "AWS Service" Setting's anomalies going to one channel, while everything else (Default) goes to another.
-
Select Users
-
Select Notify channels
-
Click on Save
-
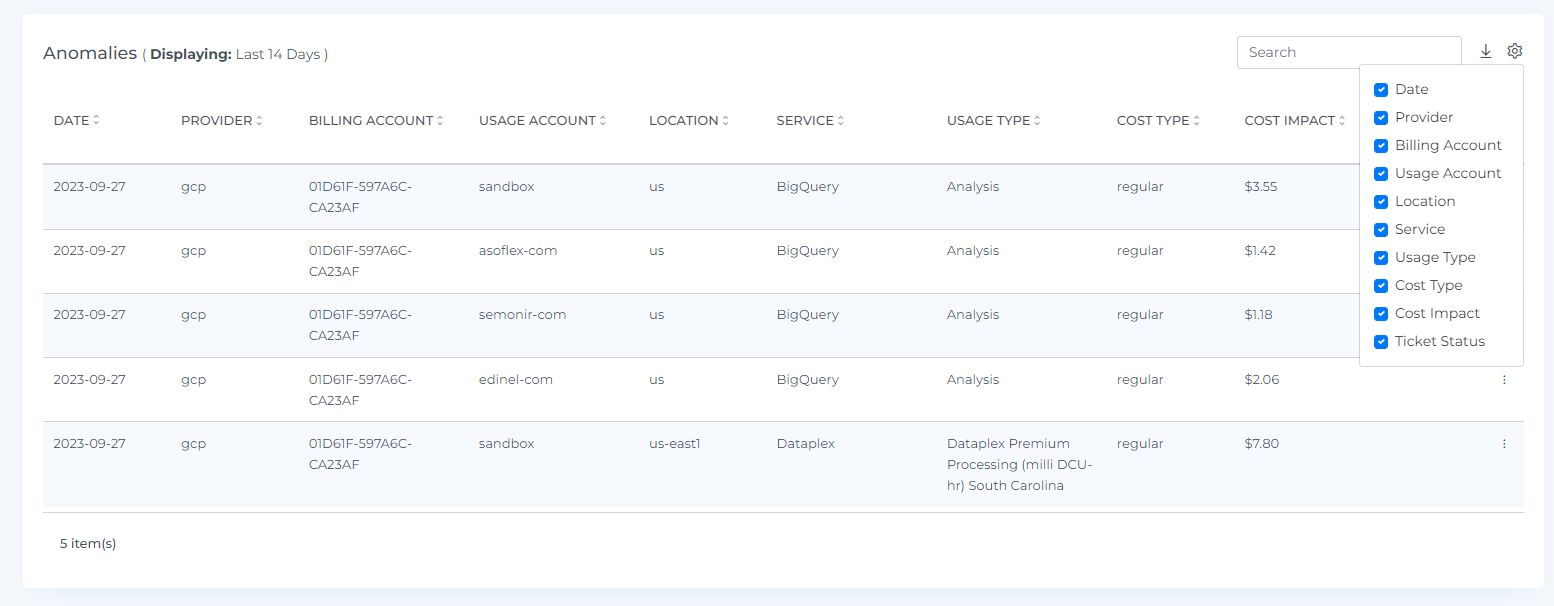
Unexpected or unusual cost fluctuations can trigger anomalies based on the thresholds you've established as shown below. When you select the number of rows, you will be able to view that same quantity of rows on the page."
-
The Anomalies table empowers users to sort, search, and download anomalies. Additionally, the settings icon enables customization of the display, aligning the anomalies with the selected view. This feature grants user's flexibility and control in accessing and utilizing anomaly data, streamlining information retrieval to meet their specific requirements.
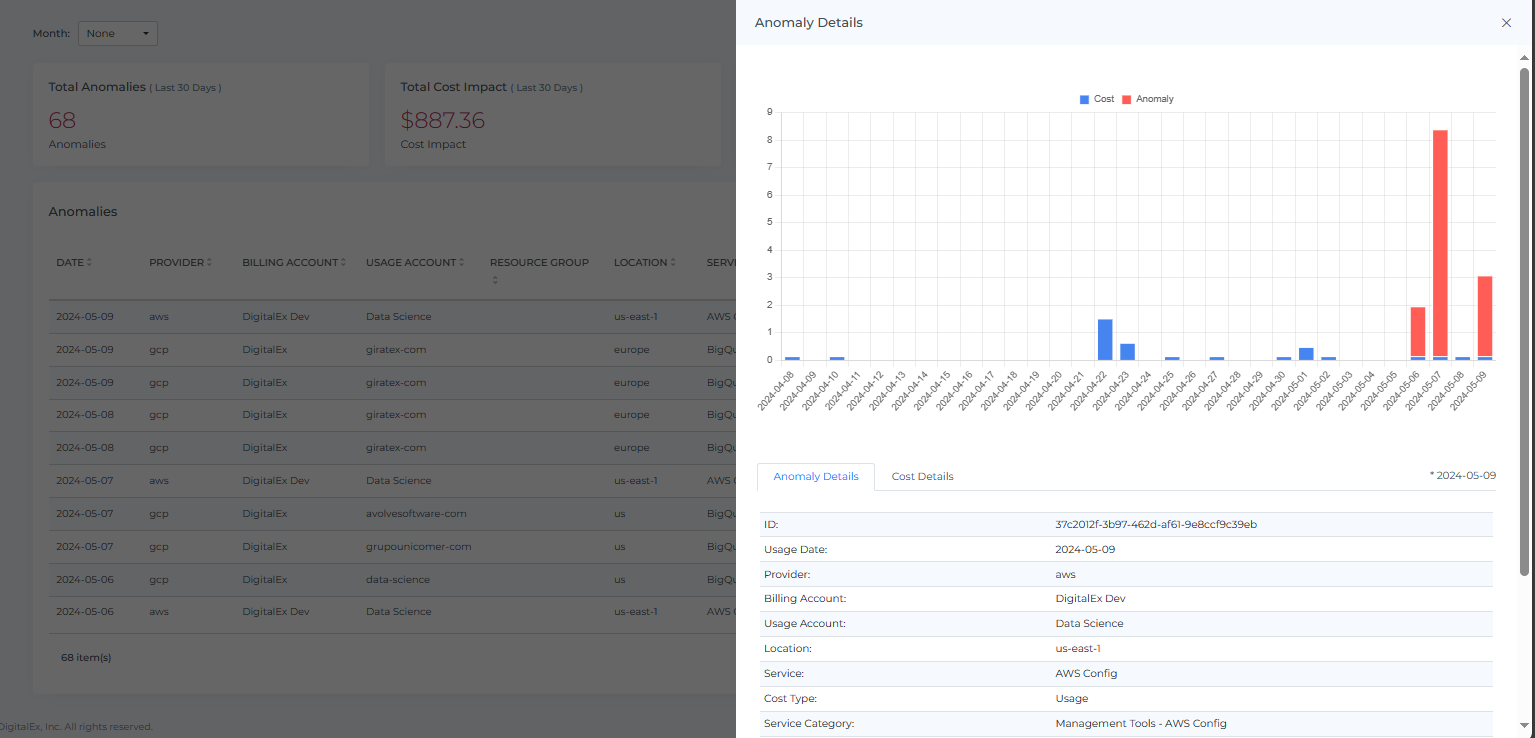
cost anomalies feature, allowing you to view detailed anomaly information. The cost chart displays costs from the last 30 days and highlights the chart of any spikes. You can also view the cost and metrics of the resource, and filter anomalies by the month you wish to review. This improvement helps users understand patterns in anomalies and take necessary actions to reduce costs.
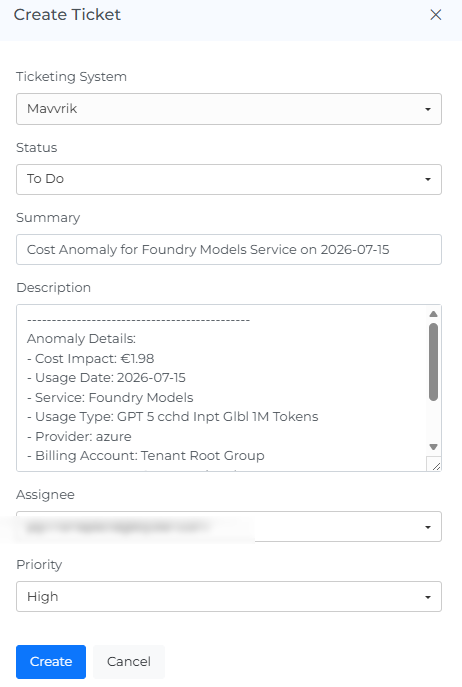
Create / Update Ticket
To initiate the ticket creation process for that specific resource, simply click the three dots in the resource's upper right corner and choose "Create Ticket." If you've previously generated a ticket, you will find the "Update Ticket" option available.
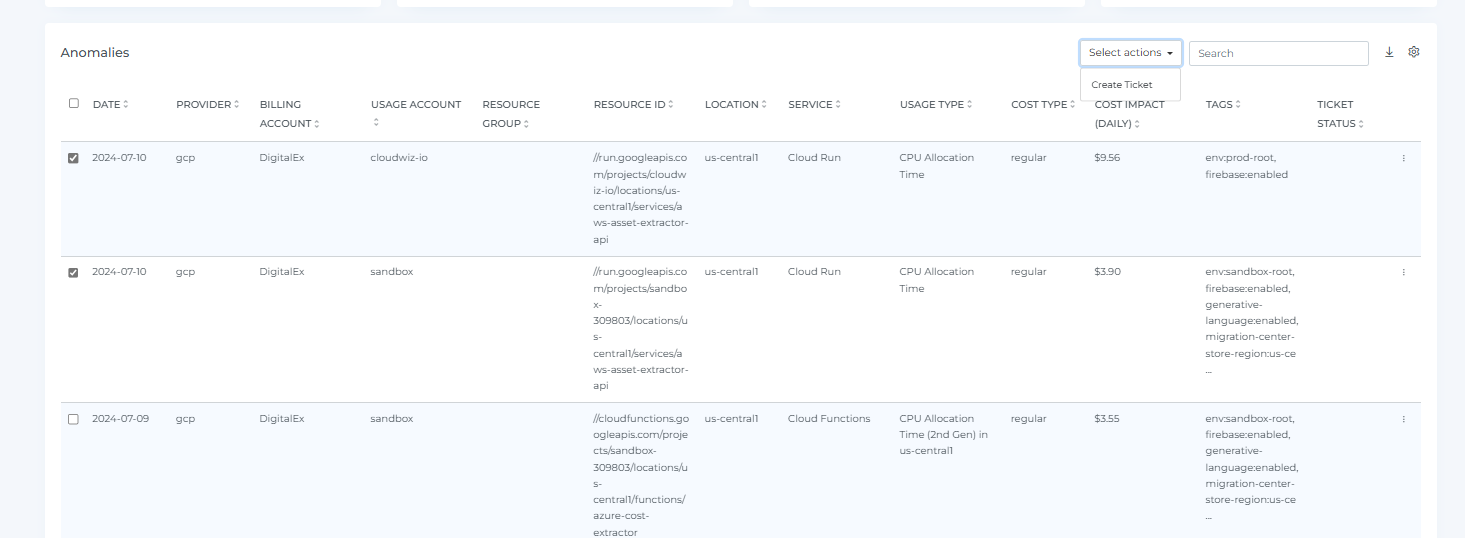
You can also generate multiple tickets at once by selecting multiple checkboxes.
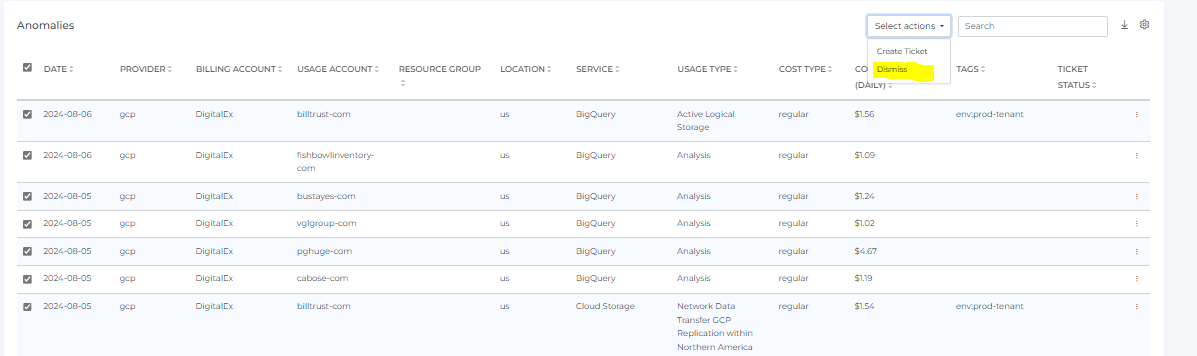
Dismiss Cost Anomalies
To begin dismissing specific anomalies, click on the three dots located in the upper right corner of the anomalies.

From the menu that appears, select the "Dismiss" option. If you have dismissed these anomalies you can not see them later.
Header Icon

Share
Click on the Share icon, copy the link of the current page, and filter if anywhere you can share it with other team members.
Bookmark and Subscription
The header also includes Bookmark and Subscription icons. See Subscriptions for how the Subscription feature works.
Screenshot
Clicking on the Camera icon, take a Screenshot of the current page, and download it in a pdf file.
Cost Anomaly Filters
Basic
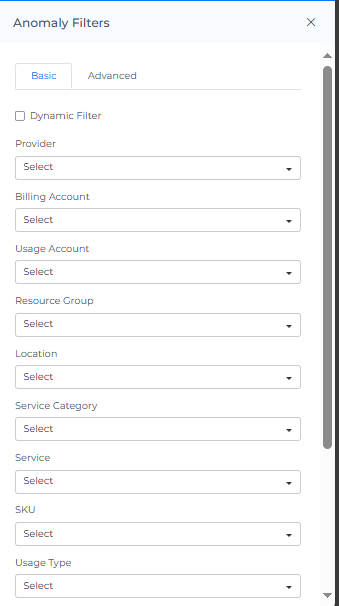
The filter option allows you to narrow down the data displayed on the page to specific criteria. You can use the filter to view Cost Anomalies for a particular Billing Account, Usage Account, Service, Instance type, or Platform. This can help you focus on specific aspects of your RI Coverage to more effectively analyze and understand the data.
On selecting Dynamic Filter adjusts options based on previous selections. For example, choosing a Provider will update subsequent filters (e.g., Billing Account, Locations) to show only relevant data for that provider. This ensures efficient and context-sensitive filtering.
Advanced
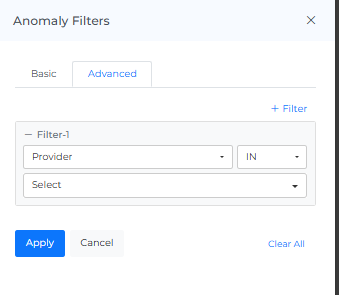
The "Advanced Cost Anomaly Filters" feature use to apply detailed filters to refine search results. You can add multiple filters by selecting criteria like "Provider," choosing an operator (e.g., "IN"), and selecting values from dropdown menus. The interface includes options to apply or cancel changes and a "Clear All" button to reset filters.
Info
The "last updated" date and time stamp show when the data on the page was last refreshed. This can be useful for understanding the age of the data and determining if it is up to date.
Reload Option
The "reset" option allows you to clear all filters and selections from the page, returning it to the default view. This can be useful if you want to start over or view the data in its original form.
Help
If you click on the "?" icon, you can access the help documentation for the page. This can provide you with additional information and guidance on using the page and its features.
Troubleshooting
-
If you dismissed an anomaly and now want to review it, note that dismissal is permanent — dismissed anomalies can't be viewed again later.
-
If anomaly notifications aren't arriving, revisit the Configure Alerts step and confirm the correct users and notify channels were selected and saved — and if you have multiple named Alert configs, confirm the right one is pointed at the right Setting.
-
If an anomaly you expected under a specific Setting's threshold instead used the Default threshold, check that Setting's Filters — an anomaly only uses a named Setting's threshold if it actually matches that Setting's scope; everything else falls through to Default.
FAQs
What's the difference between AND and OR when adding multiple threshold conditions?
AND requires every condition to be met before an alert triggers. OR triggers the alert if any one of the conditions is met — useful when you want to catch several different kinds of unusual spend with a single setting. This choice only appears once you've added a second condition via "+ Threshold".
How does Mavvrik decide what counts as an anomaly?
It compares current spend against a baseline built from six months of historical trend, rather than a simple day-over-day or last-30-day comparison. This catches gradual unusual growth that a fixed threshold would miss, and avoids flagging normal seasonal patterns as false alarms.
What's the difference between the Default Setting and a Setting I add myself?
Default has no filters and always covers everything not matched by one of your own named Settings — think of it as "Scope: All Others." A Setting you add via "+ Setting" is scoped with its own Filters/Advanced Filters (e.g. a specific Service or Tag) and has its own independent Threshold, letting you tune sensitivity differently per account, service, or tag.
Can different Settings notify different people?
Yes — add multiple Alert configs via "+ Alert" in the Alerts tab, and point each one at a different Setting using its "Setting" dropdown. Each Alert config has its own Notify Users/Channels and can optionally override that Setting's threshold just for itself.