.png)
The AI Assist dashboard provides visibility into AI assistant usage, costs, products, users, and operations across your organization. It helps users understand AI consumption patterns, identify top contributors, and optimize AI-related spending.
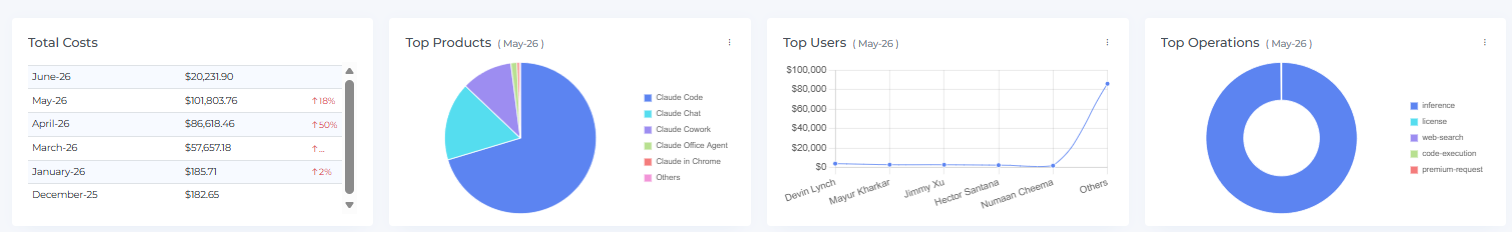
Total Costs
The Total Costs widget allows you to view the total AI Assist costs associated with your AI providers. When AI usage is recorded, the cost data will be displayed starting from the month in which usage was incurred.
The percentage increase and decrease values shown in the widget are based on the previous month's data. This means that the widget will not show percentage increase or decrease values for the first month in which data is available or for the current month.
Top Products
The Top Products widget allows you to view the products contributing the most to AI Assist costs. The widget displays a pie chart, with each slice representing a product.
You can hover over a slice to view the associated cost. The size of each slice corresponds to the total cost incurred by that product.
This widget helps identify which AI products are driving the highest usage and spending.
Top Users
The Top Users widget displays the users generating the highest AI Assist costs.
The widget ranks users based on their consumption and provides visibility into the top contributors to AI spending. This can help organizations understand adoption trends and identify opportunities for optimization.
Top Operations
The Top Operations widget displays a breakdown of AI operations performed during the selected period.
Operations may include Inference, License, Web Search, Code Execution, Premium Requests
The donut chart visually represents the distribution of costs across operation types, helping users understand which activities contribute most to overall AI expenses.
Widget Builder
The Top Products, Top Users, and Top Operations widgets can be customized to suit your specific needs.
To customize a widget, click the three-dot menu in the upper-right corner of the widget. A menu will provide options such as Edit & Restore
Restore returns the widget to its default configuration.
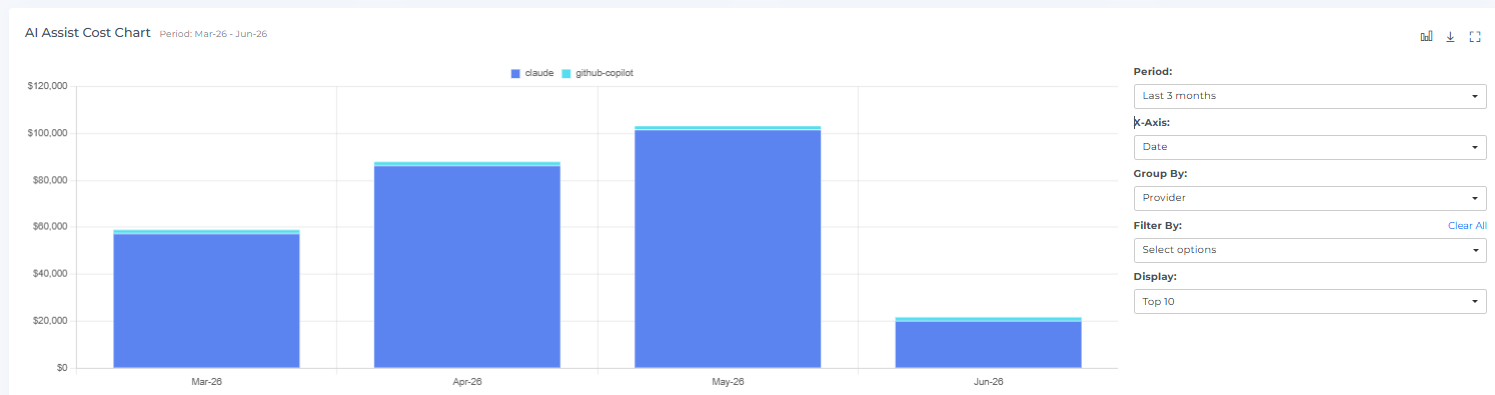
AI Assist Cost Chart
The AI Assist Cost Chart is a graphical representation of AI Assist costs over time.
It displays costs by period and allows users to analyze spending trends across providers, products, users, and operations.
You can hover over chart elements to view detailed cost information.
You can click a bar or chart segment to view the related AI Assist Cost Items.
The chart can be expanded to full-screen mode and downloaded for reporting purposes.
Chart Filters
The AI Assist Cost Chart supports multiple filtering options:
Period
Allows you to select the timeframe for analysis, such as Last 6 Months, Last 12 Months, Custom ranges
X-Axis
Allows you to change the chart dimension, such as Date, User, Product, Operation
Group By
Allows you to group data by Provider, Product, User, Operation
Filter By
Allows you to filter chart data using available dimensions and attributes.
Display
Allows you to control the number of records displayed in the chart.
These options help users focus on the most relevant data and perform detailed analysis.
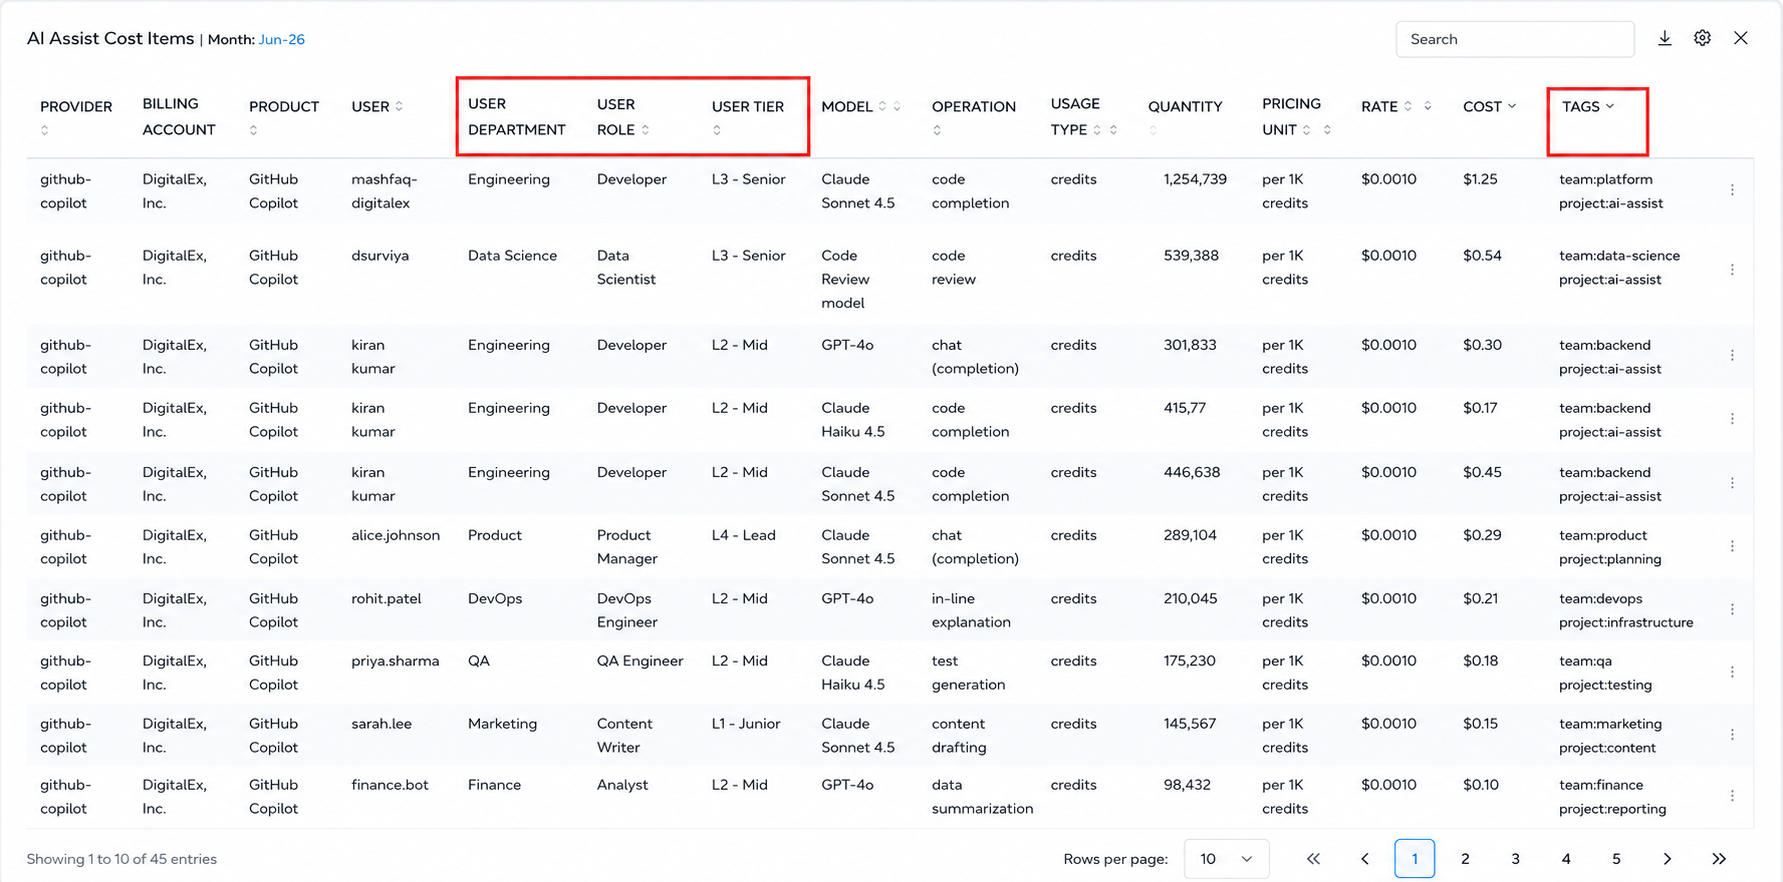
AI Assist Cost Items
The AI Assist Cost Items table displays detailed usage records related to the selected chart or widget.

The table includes information such as Provider, Billing Account, Product, User, User Email, Model, Operation, Usage Type, Cost Type, Quantity, Pricing Unit, Rate, Cost, Location
The table supports Sorting, Searching, Downloading data, Column customization
When a user selects a chart element or widget item, the Cost Items table automatically updates to display the associated records.
Header Icons
The dashboard includes several header icons for quick access to common actions.
Download
Download chart data or reports.
Refresh
Reload the dashboard and refresh displayed data.
Settings
Configure dashboard preferences and display options.
Help
Open the AI Assist help documentation.
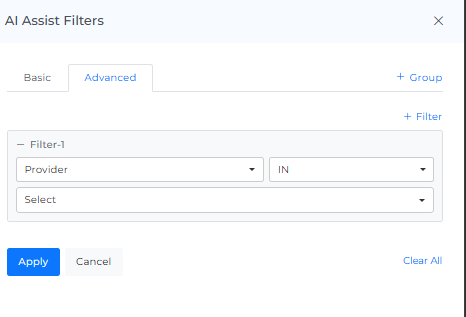
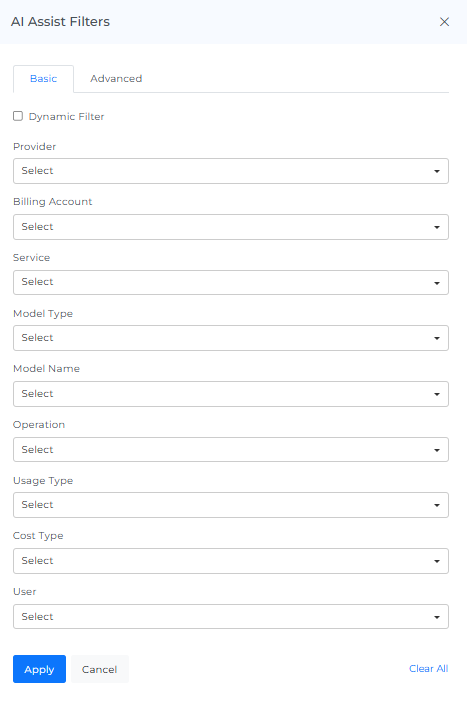
AI Assist Filter
Basic
You can filter the complete page using this option. For Example, if you want to view the AI Assist by provider, select the any one filter or if you want to view the AI cost of a particular Billing Account, Cost Type, Service, or Location
On selecting Dynamic Filter adjusts options based on previous selections. For example, choosing a Provider will update subsequent filters (e.g., Billing Account, Service) to show only relevant data for that provider. This ensures efficient and context-sensitive filtering.
Advance
The "Advanced AI Cost Filters" feature use to apply detailed filters to refine search results. You can add multiple filters by selecting criteria like "Provider," choosing an operator (e.g., "IN"), and selecting values from dropdown menus. The interface includes options to apply or cancel changes and a "Clear All" button to reset filters.