.png)
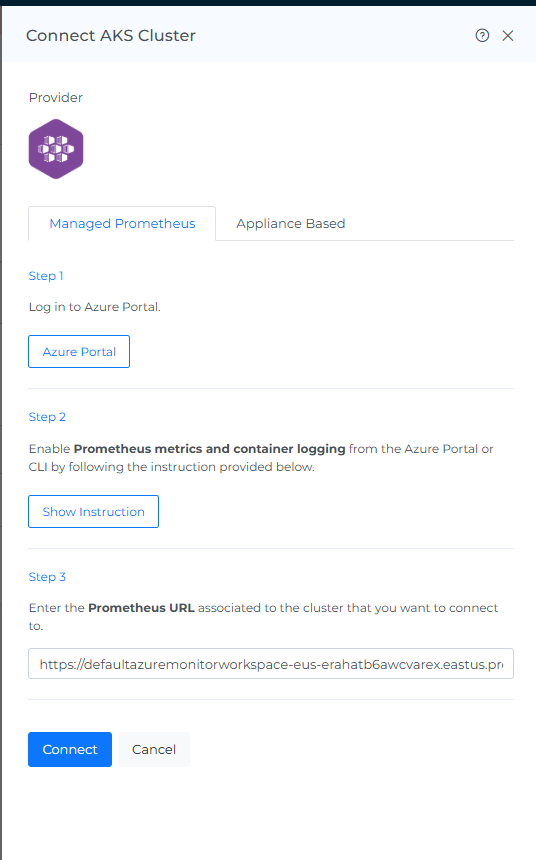
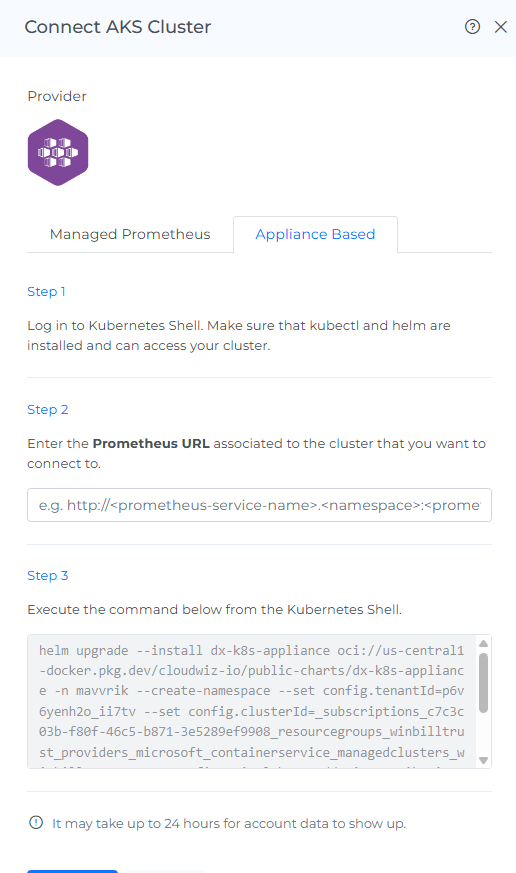
Mavvrik supports two ways to connect an AKS cluster, as shown in the Connect AKS Cluster screen:
-
Managed-Prometheus Based – recommended when you want onboarding without installing appliance
-
Appliance-Based – recommended when you need deeper telemetry and more detailed Kubernetes insights.
Steps to onboard the AKS cluster(Appliance based)
Before onboarding your AKS account, you must have the admin rights on the cluster that you want to onboard and follow the steps below
Step-1: Install helm and kubectl in Azure .
If Helm and kubectl are already installed, skip the steps below and proceed to https://help.mavvrik.ai/content/aks-azure-kubernetes-service-onboarding#AKS-AzureKubernetesserviceonboarding-Step-2:StepstoperforminMavvrik .
If they are not installed, follow the steps below to install them
-
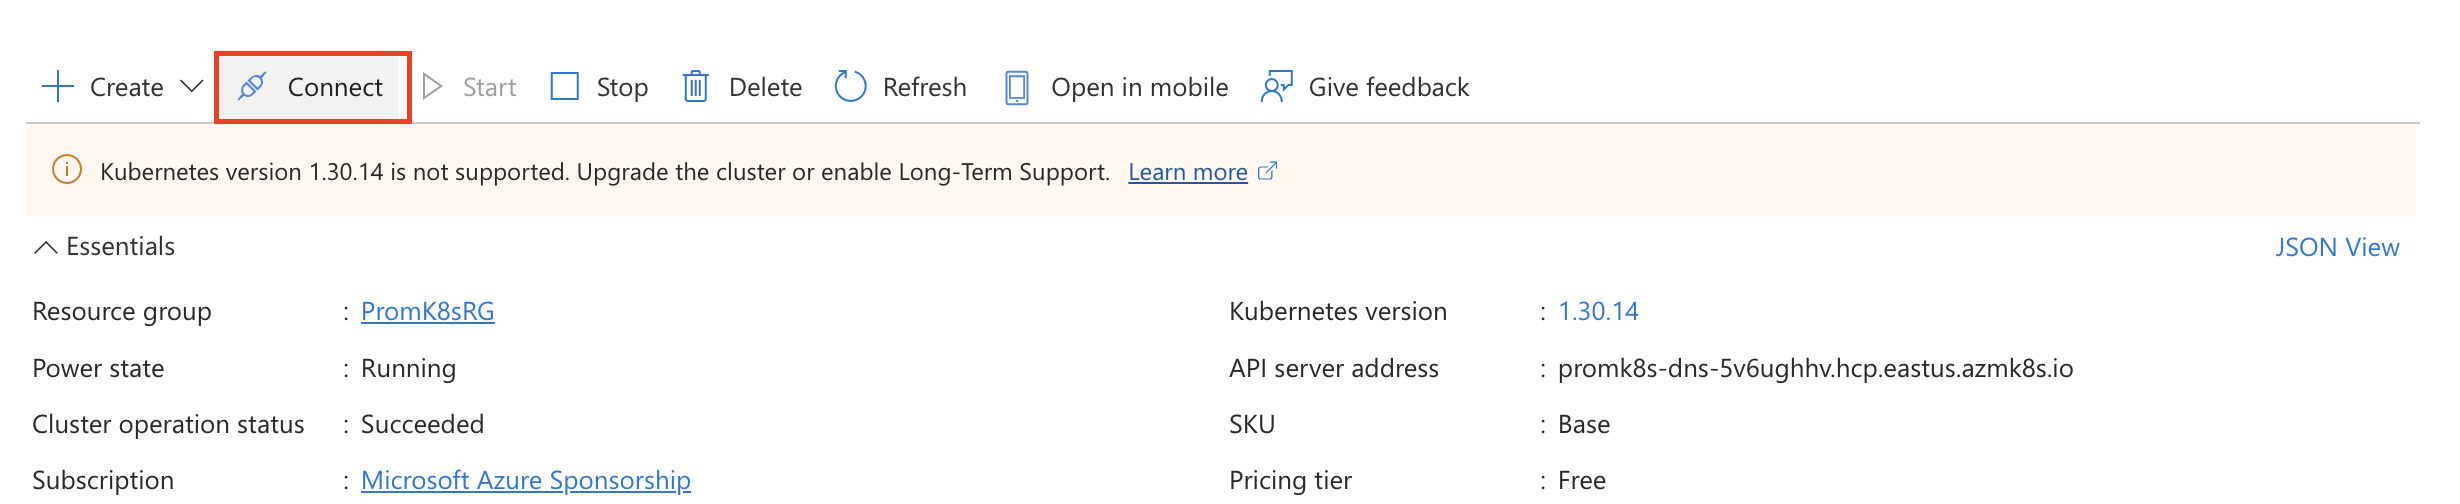
Navigate to Kubernetes services in the Azure .
-
Click on the cluster you want to connect.
-
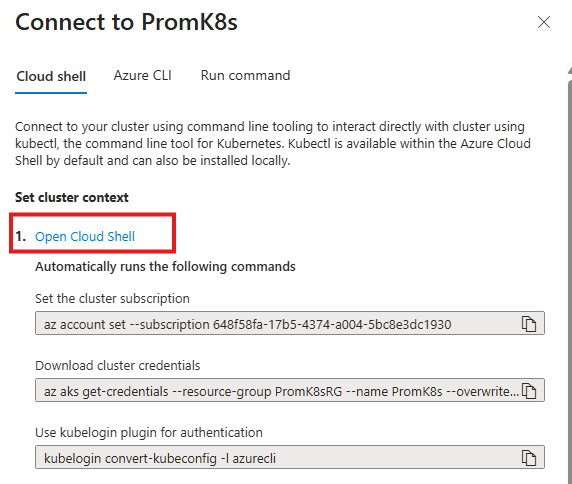
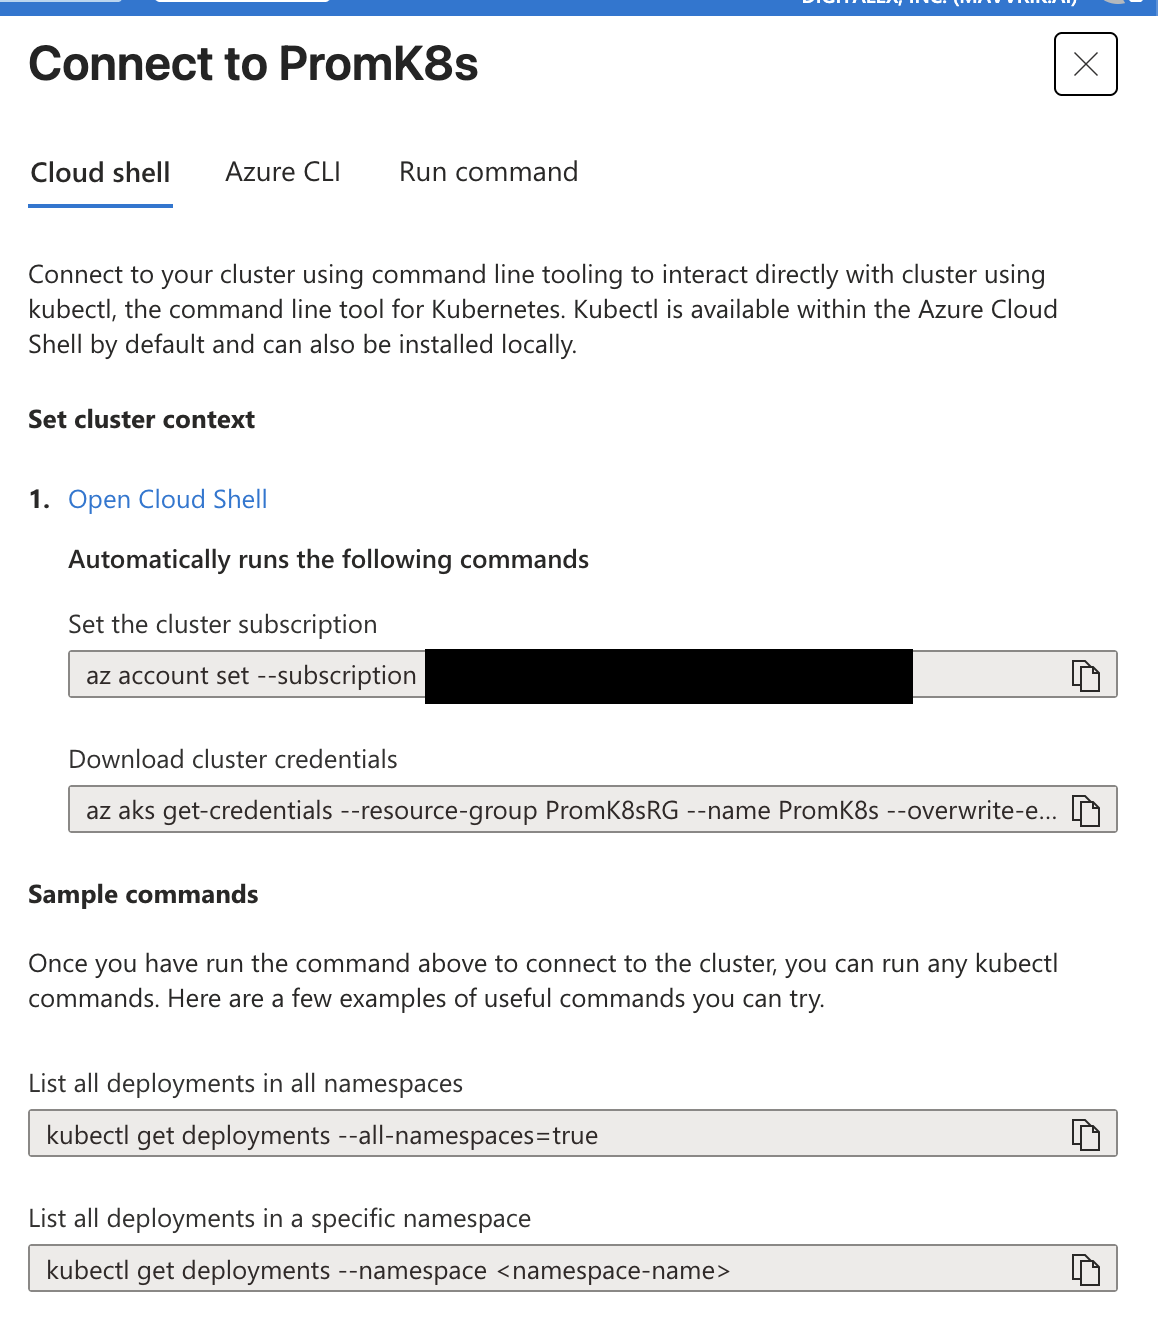
Click on the connect button

-
Click on Open Cloud Shell which will run the commands automatically
-
Install kubectl in the already opened cloud shell
#bash az aks install-cli -
Install Helm in the already opened cloud shell
#Windows
winget install Helm.Helm

#macOS
brew install helm

#Linux
curl https://raw.githubusercontent.com/helm/helm/main/scripts/get-helm-3 | bash
Step-2: Steps to perform in Mavvrik
-
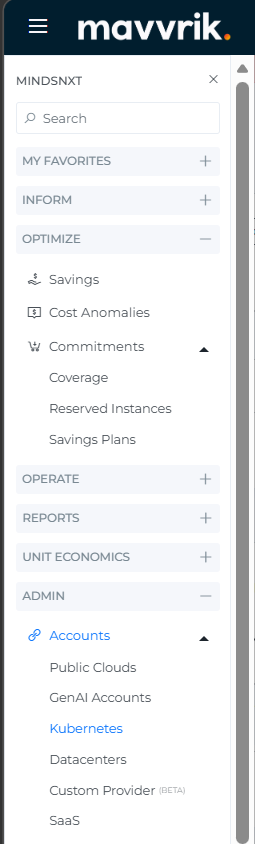
Go to the Menu
-
Click on Admin → Kubernetes
-
Click on the AKS tab
-
Click on 'Connect'
-
Enter your Prometheus URL
Steps to get Prometheus URL
-
Capture the Prometheus URL associated with the K8s cluster:
a. Enter the following URL in Mavvrik UI
http://<prometheus-server-name>.<namespace>:<prometheus-internal-port>
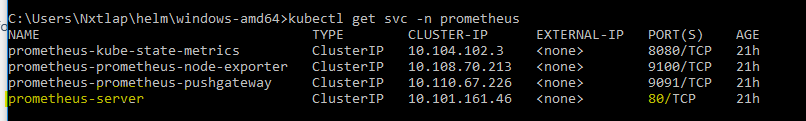
b. To find the Prometheus service, run the following command in Kubernetes shell
kubectl get svc -n prometheus
-
In URL Replace
prometheus-server-name,namespace&prometheus-internal-portwith your data -
The following screenshot shows an example of a URL
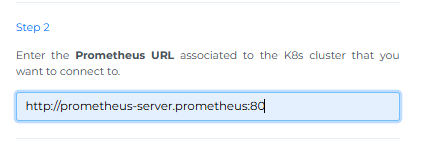
-
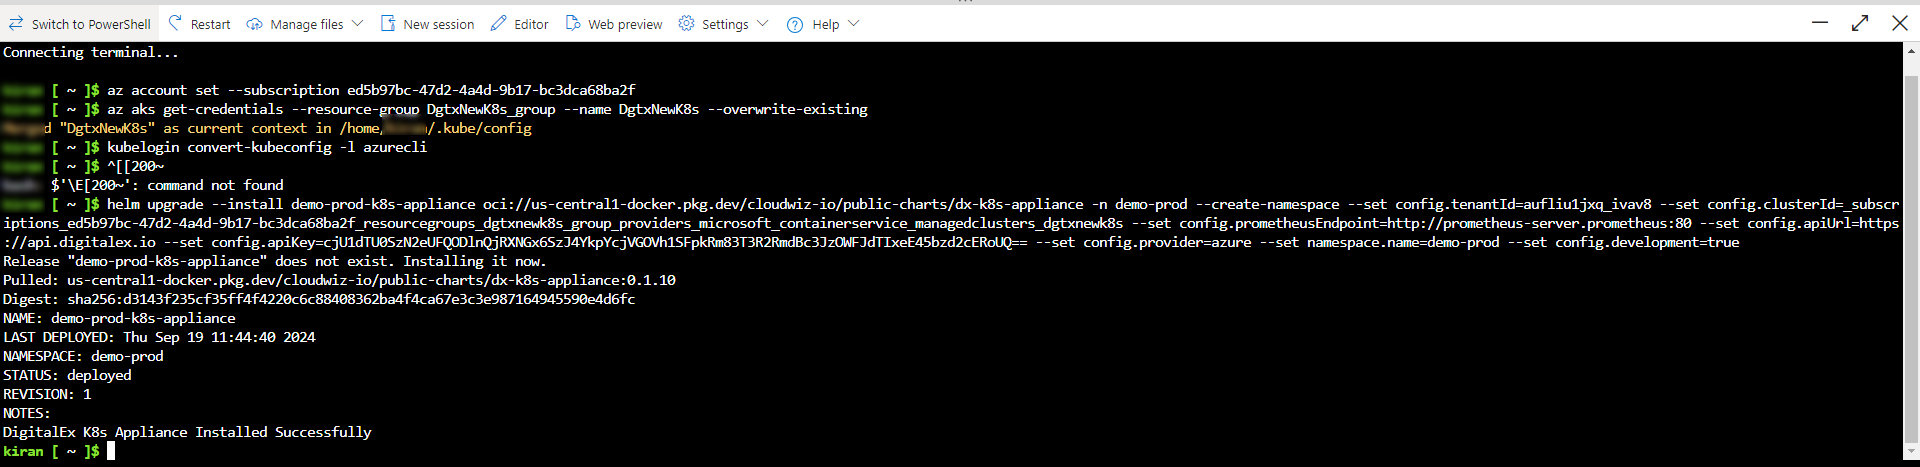
Copy the Mavvrik UI Step-3 Kubernetes Shell command and run it in azure cloud shell which is already opened from the previous steps
-
After executing the command, the Kubernetes appliance will be installed
8. Click on the Connect button in Mavvrik
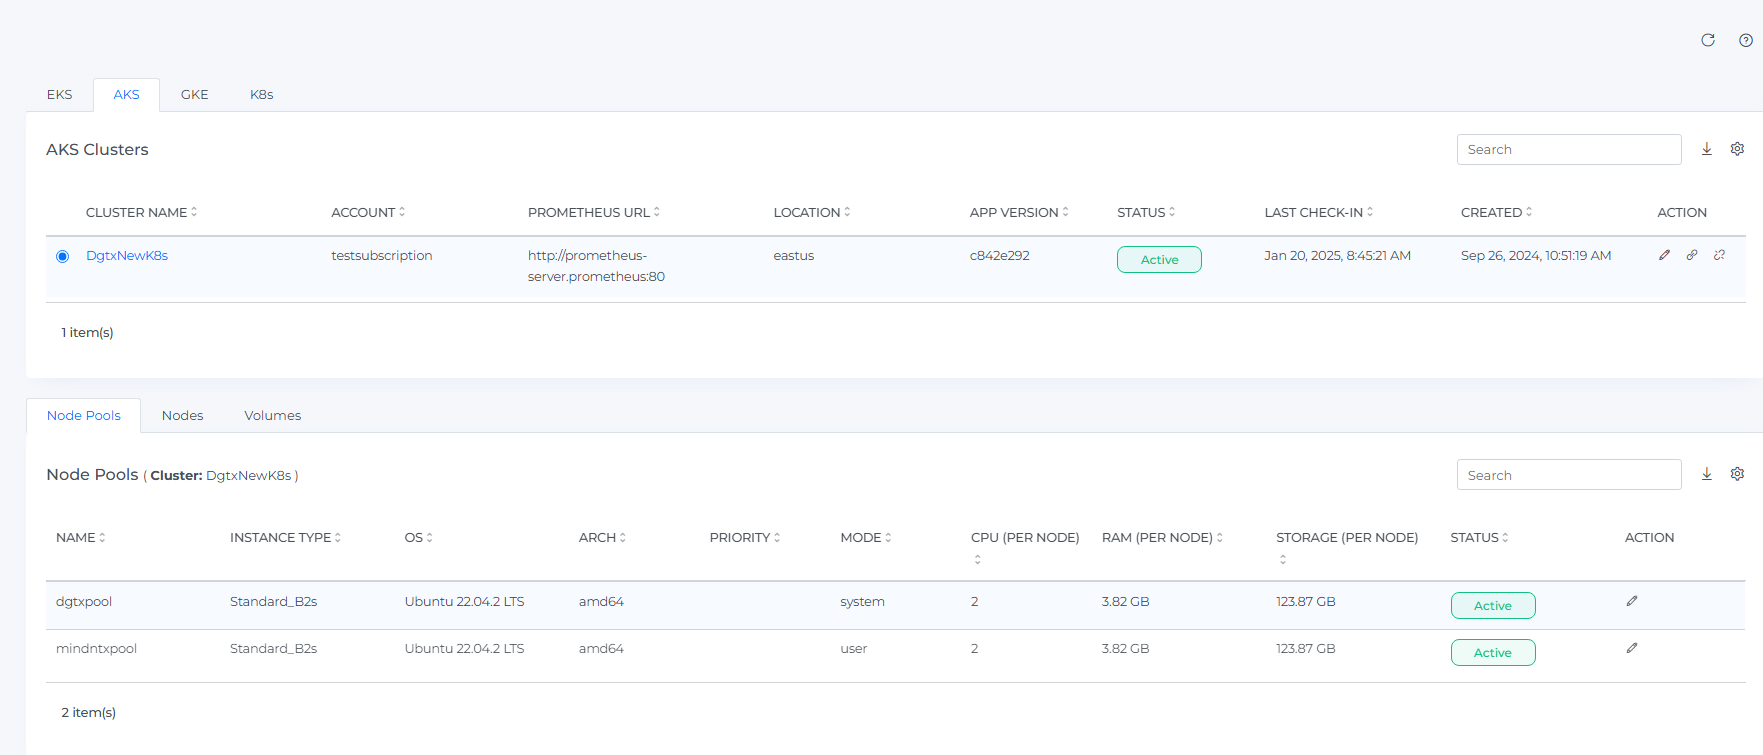
Direct Cluster Navigation
There is a clickable link on the cluster names. This allows to seamlessly navigate to detailed cost insights for each cluster directly from the Kubernetes Admin page.
Instructions to Enable Monitoring and Create Workspace (Managed Prometheus)
To enable monitoring for the AKS cluster, the user must be assigned either the Monitoring Reader or Monitoring Contributor role.
Below is the required workspace information for Azure Monitor:
|
Feature |
Workspace |
Notes |
|---|---|---|
|
Managed Prometheus |
Azure Monitor workspace |
If you don’t specify an existing Azure Monitor workspace during onboarding, the default workspace for the resource group will be used. If a default workspace does not exist in the cluster’s region, one will be automatically created with the name format DefaultAzureMonitorWorkspace-<mapped_region> in a resource group named DefaultRG-<cluster_region>. |
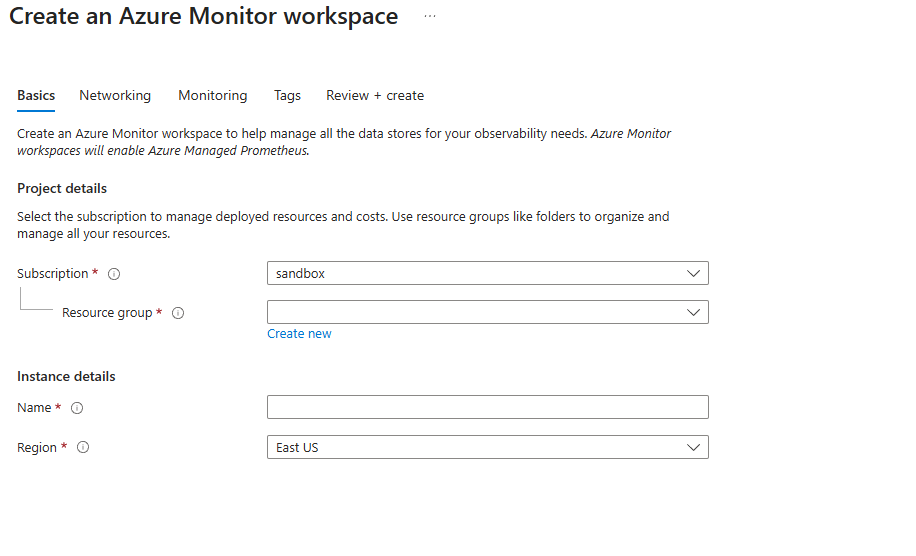
Below are the steps to create workspace
-
Log in to the Azure portal (https://portal.azure.com/ , user must have the above-mentioned roles)
-
search “Azure Monitor workspaces.”
-
Click on +create
-
Subscription – Select your subscription
-
Resource Group – Select existing or create new
-
Workspace Name – Provide a unique name
-
Region – Choose the same region as your AKS cluster
-
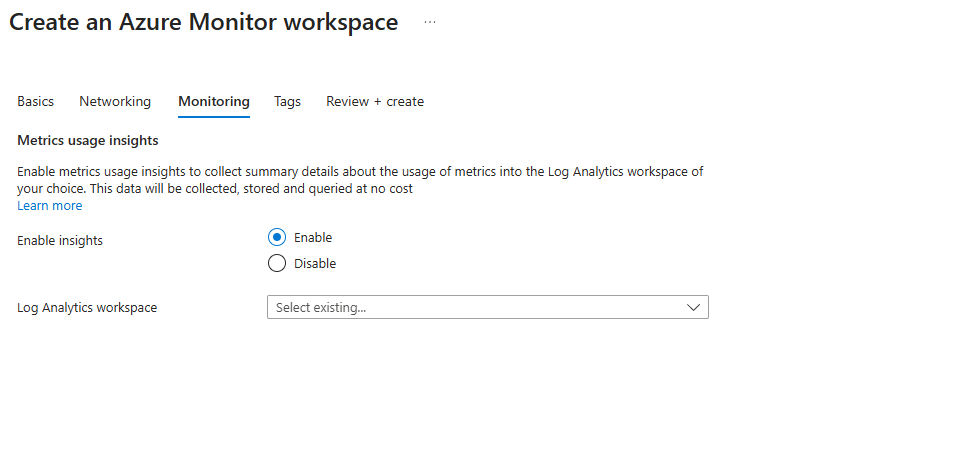
Click on the monitoring tab
-
Click on enable
-
Select Log Analytics workspace
-
Click on Review + create
-
Click on Create
Instructions to Enable Prometheus metrics and container logging (Managed Prometheus)
Mavvrik Kubernetes Solutions requires more metrics related to CPU, Memory, GPU, Volume which needs extra configuration at cluster level
-
Login to Cluster using connect
follow the steps to connect to the cluster
-
create the following configMap: ama-metrics-settings-cm.yaml
apiVersion: v1
kind: ConfigMap
metadata:
  name: ama-metrics-settings-configmap
  namespace: kube-system
data:
  # Optional: set a stable cluster label; otherwise AKS name is used.
  prometheus-collector-settings: |-
    cluster_alias = ""

  # Ensure default targets are enabled (kubestate is required for kube_node_labels).
  default-scrape-settings-enabled: |-
    kubelet = true
    coredns = true
    cadvisor = true
    kubeproxy = true
    apiserver = true
    kubestate = true
    nodeexporter = true
    windowsexporter = false
    windowskubeproxy = false
    prometheuscollectorhealth = false

  # Ingest ALL metrics scraped for the default targets (can significantly increase volume).
  default-targets-metrics-keep-list: |-
    minimalingestionprofile = false

  debug-mode: |-
    enabled = false

  # kube-state-metrics configuration override: allowlist node label carrying AKS nodepool name
  # (will appear in Prometheus as label_kubernetes_azure_com_agentpool).
  ksm-config: |-
    labels_allow_list:
      pods:
      - app
      - app.kubernetes.io/name
      - app.kubernetes.io/instance
      - k8s-app
      nodes:
      - kubernetes.azure.com/agentpool
This is enable all the required metrics for Mavvrik Data Collection.
-
Create the configmap using
kubectl create -f ama-metrics-settings-cm.yaml
Verification Steps:
-
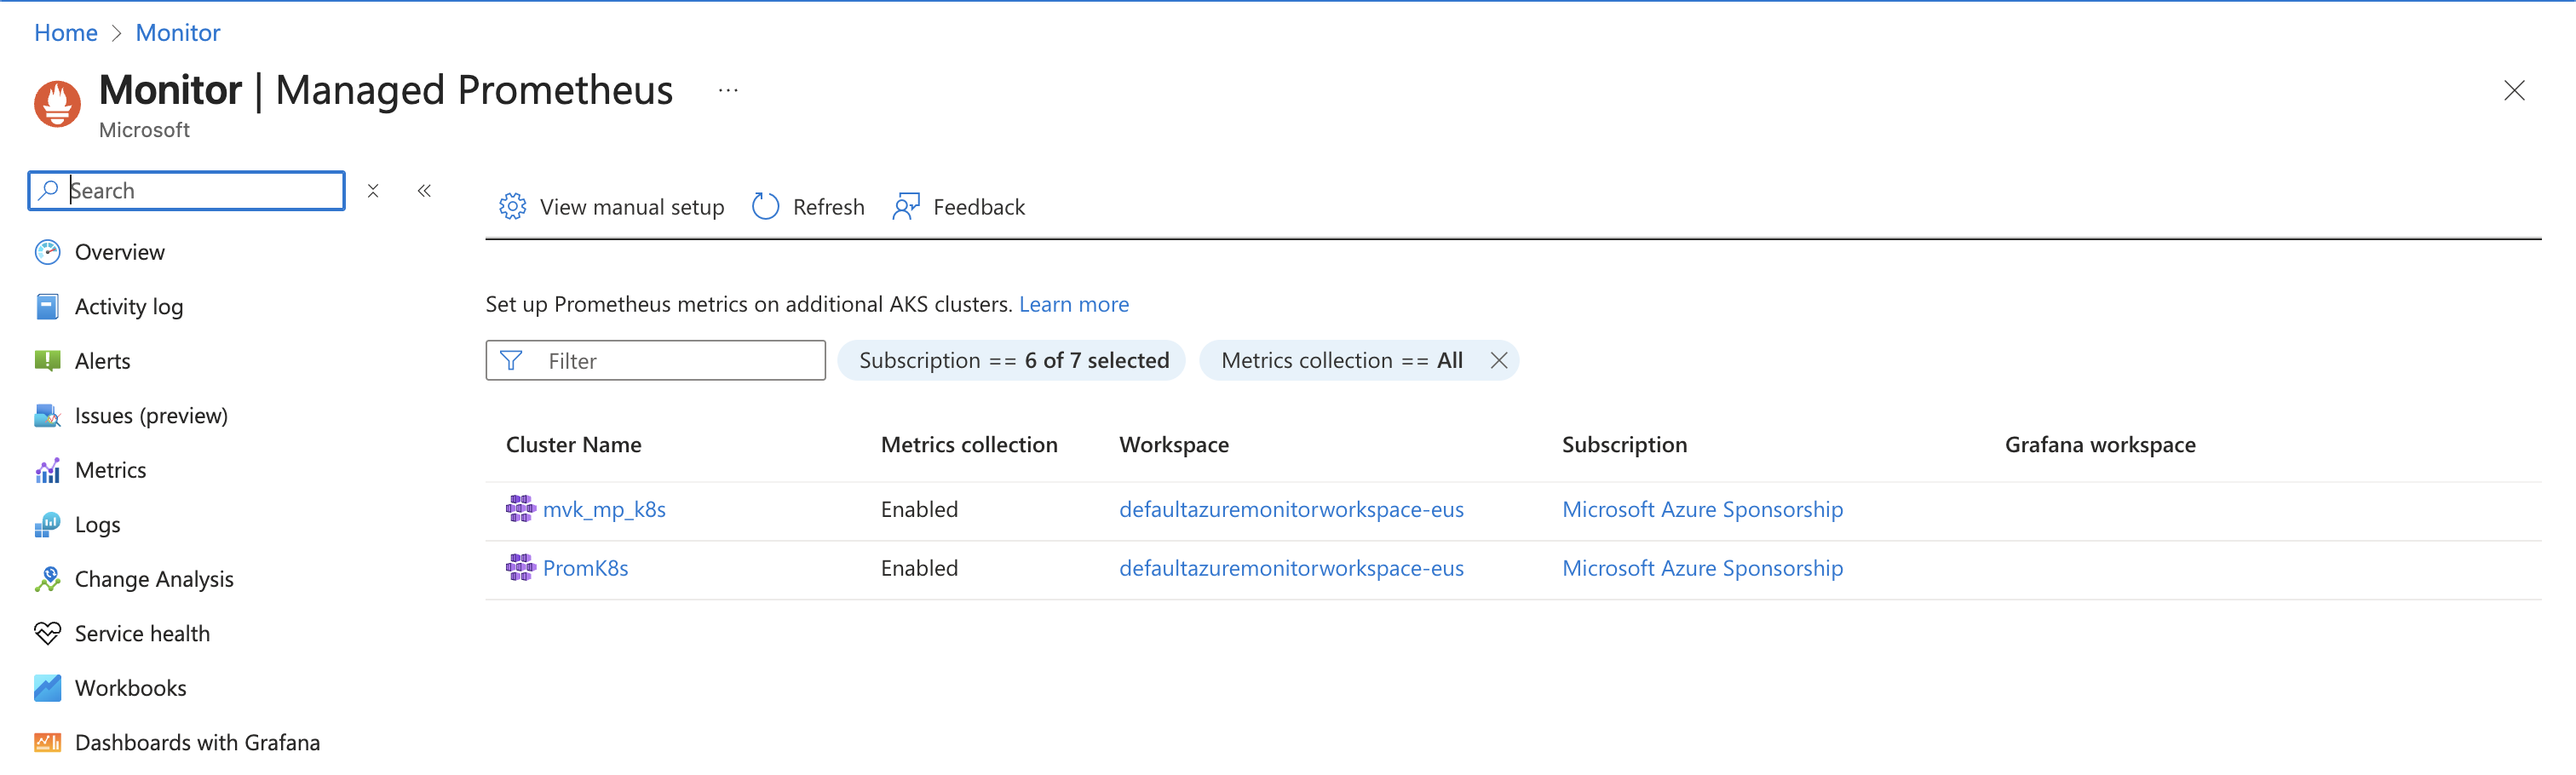
Navigate to Managed Prometheus Page in Azure Portal
-
Select the Workspace/Cluster for which configmap was applied in above steps:
-
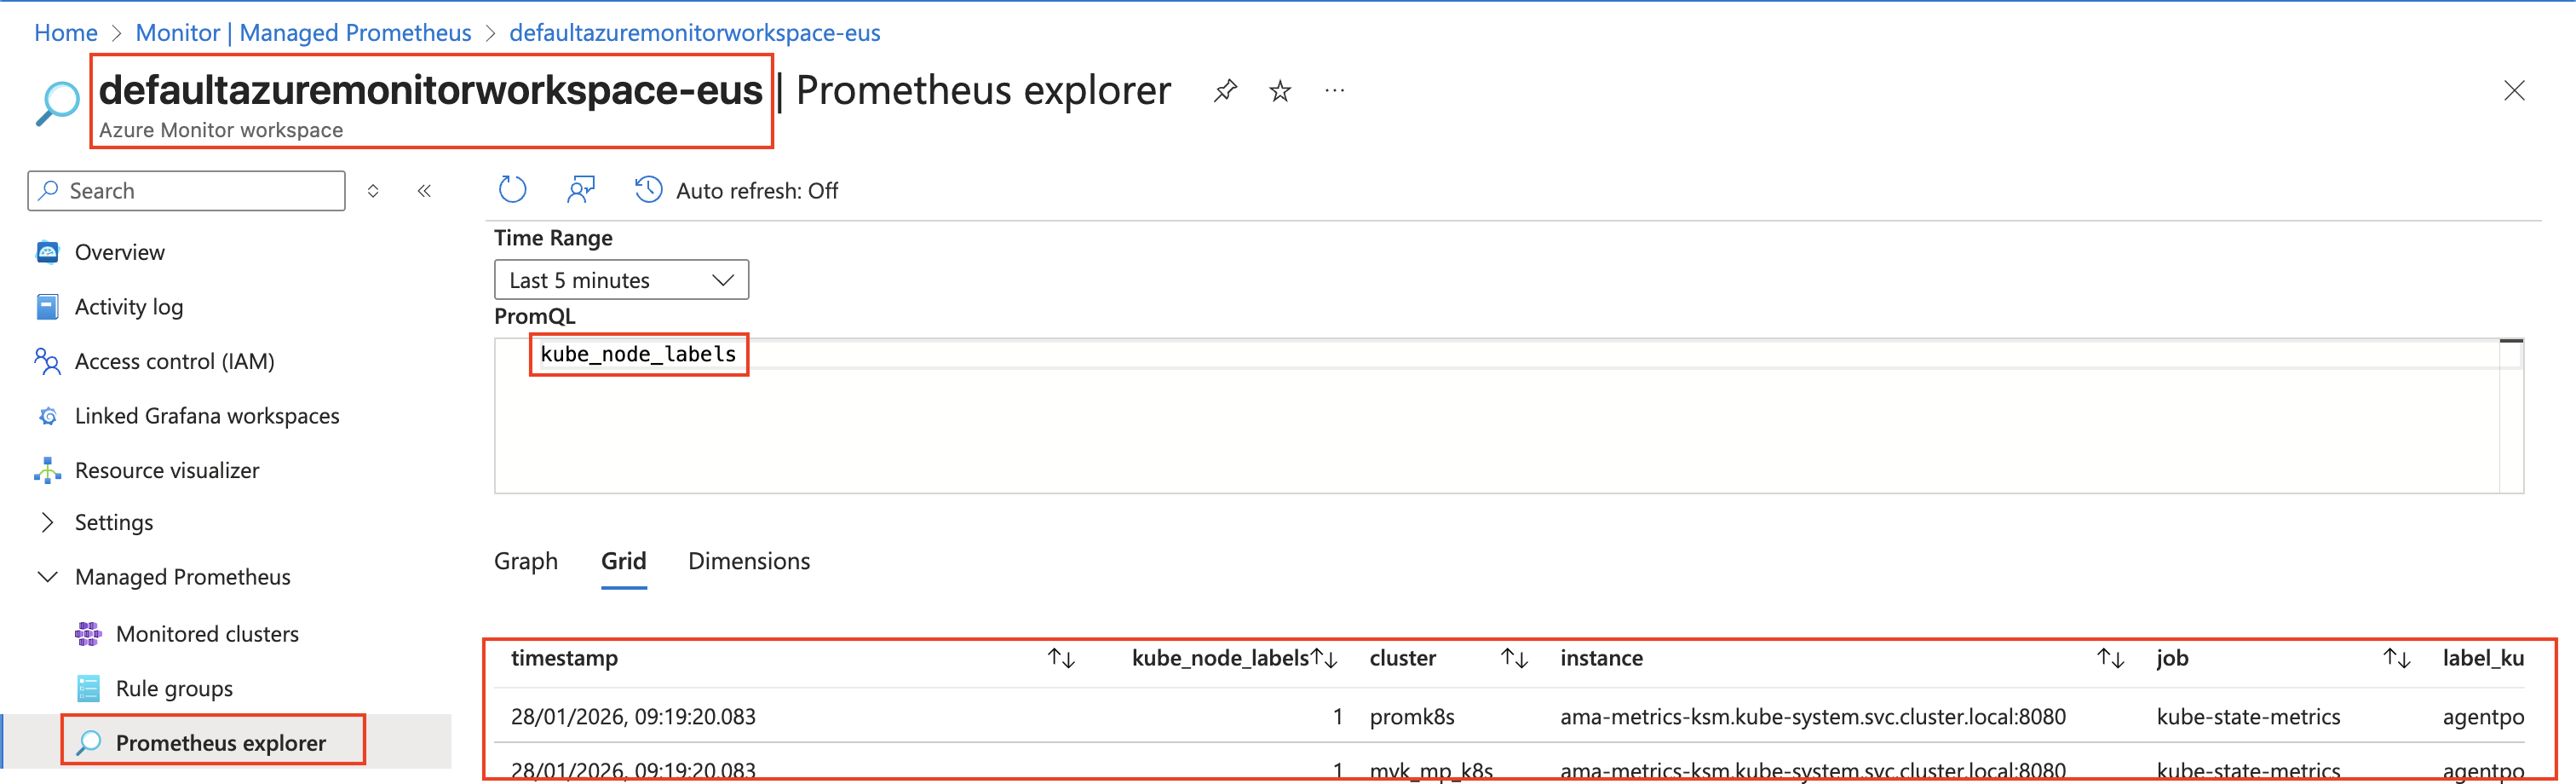
On the left hand side Select Managed Prometheus > Prometheus explorer
-
then select the time range to 5 mins > in PromQL console search for kube_node_labels metrics it should provide results like below, which confirm all configMap is deployed successfully.
-
-
Navigate to Mavvrik portal > Admin > K8s and connect the managed Promethous cluster